


Fig. 3.
Download original image
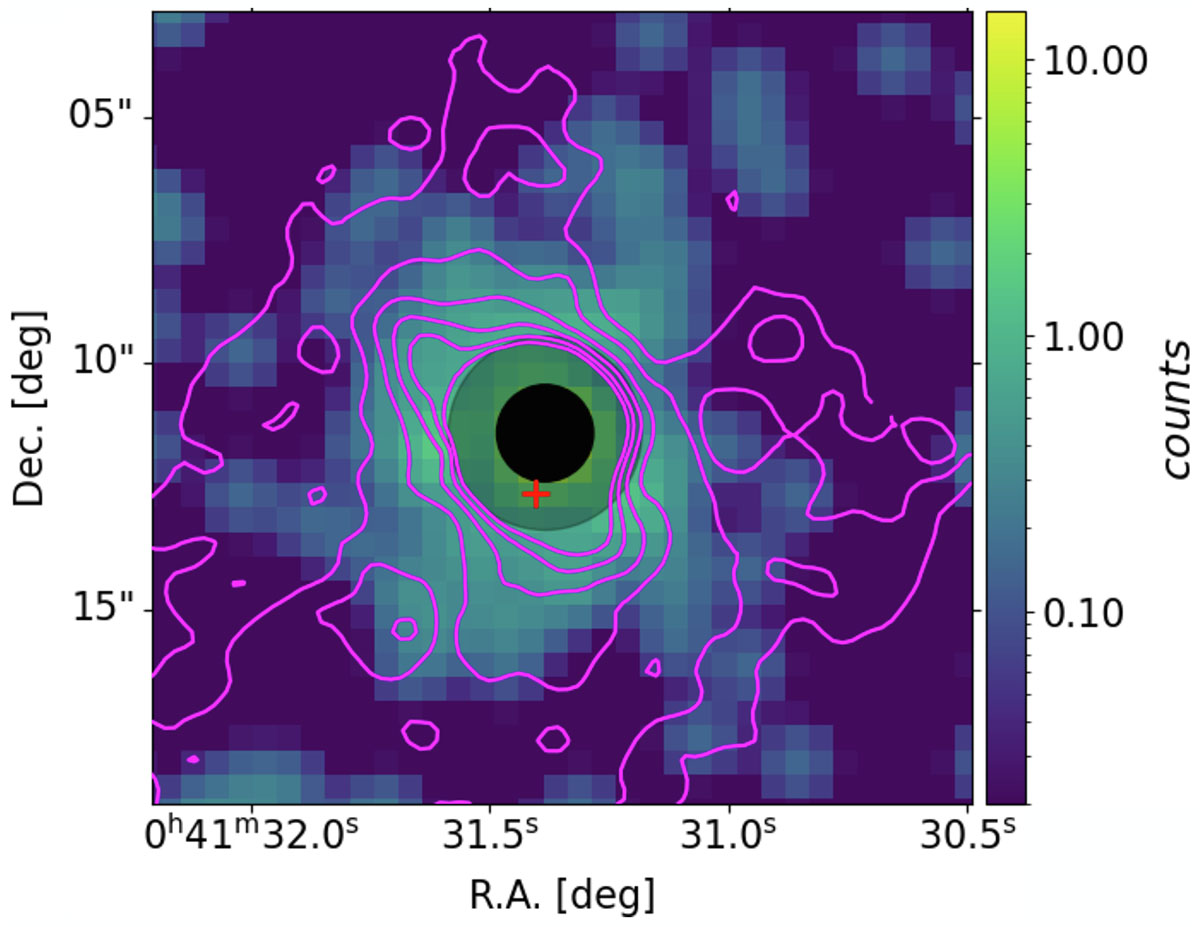
Smoothed soft X-ray 0.5–2.0 keV count map of the extended X-ray emission, obtained after subtracting the QSO’s PSF contribution. The filled black dot marks the QSO centre with a radius of 1″, while the transparent dot represents the inner 2″ region, where counts are used to rescale the PSF to the image. The magenta contours trace the Lyα nebula at surface brightness (SB) levels of 2.5, 4, 6, 8, 10, and 12 × 10−18 ergs−1 cm−2 arcsec−2. The red cross marks the position of the QSO companion detected with ALMA.
Current usage metrics show cumulative count of Article Views (full-text article views including HTML views, PDF and ePub downloads, according to the available data) and Abstracts Views on Vision4Press platform.
Data correspond to usage on the plateform after 2015. The current usage metrics is available 48-96 hours after online publication and is updated daily on week days.
Initial download of the metrics may take a while.