


Fig. 2.
Download original image
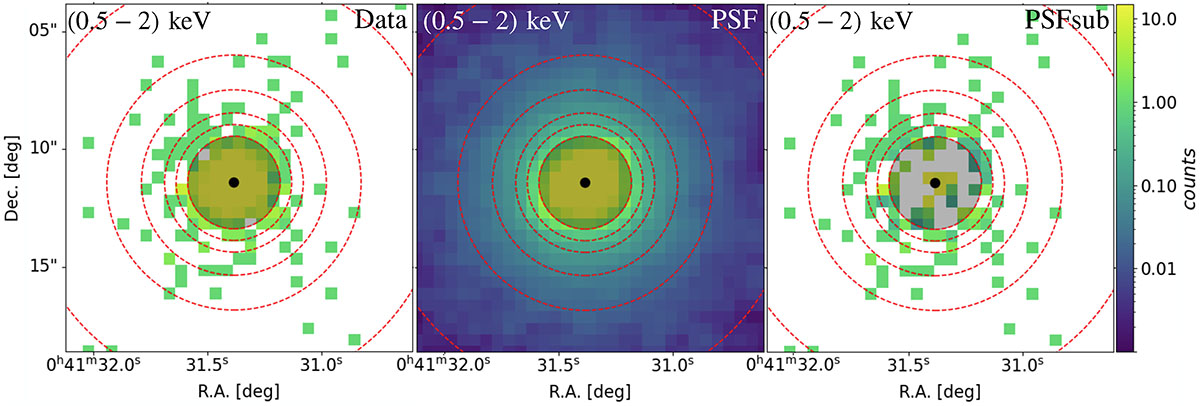
Data (left), simulated PSF (middle), and PSF-subtracted (right) images at the 0.5–2 keV energy band. Dashed red circles indicate the radial bins used for profile extraction, corresponding to the following radii: ∼2″, 2.5″, 3″, 4″, 5.5″, 8.9″, 10.3″, and 11.3″. The QSO position is marked with a black dot, and the shaded black circle represents the 2″ radius used to normalize PSF counts to the data. The annular region between 2″ and 4″ may include approximately 6 background counts.
Current usage metrics show cumulative count of Article Views (full-text article views including HTML views, PDF and ePub downloads, according to the available data) and Abstracts Views on Vision4Press platform.
Data correspond to usage on the plateform after 2015. The current usage metrics is available 48-96 hours after online publication and is updated daily on week days.
Initial download of the metrics may take a while.