


Fig. D.1.
Download original image
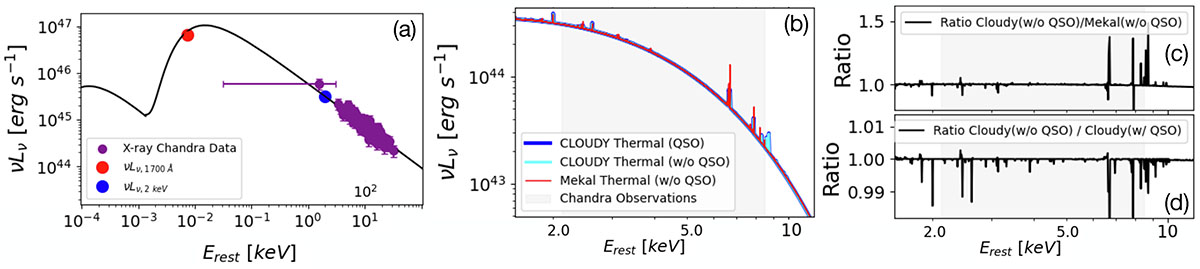
Impact of QSO photoionization on the thermal emission in the observed 0.5-2 keV energy band (highlighted by the shaded grey region). Panel (a) shows the SED adopted to represent the QSO radiation field, constrained by two photometric measurements (UV and X-ray; red and blue dots) for this source and by the power-law slope Γ ≈ 2.1 used to match the unfolded Chandra X-ray data (purple dots). Panel (b) compares the thermal emission spectrum predicted by the standard xsmekal model (red line) with that obtained from Cloudy simulations including QSO photoionization (see text for details). Panel (c) shows the ratio between the Cloudy model with QSO photoionization and the xsmekal model. Panel (d) displays the ratio between Cloudy thermal models computed with and without the QSO radiation field, illustrating the net impact of photoionization.
Current usage metrics show cumulative count of Article Views (full-text article views including HTML views, PDF and ePub downloads, according to the available data) and Abstracts Views on Vision4Press platform.
Data correspond to usage on the plateform after 2015. The current usage metrics is available 48-96 hours after online publication and is updated daily on week days.
Initial download of the metrics may take a while.