


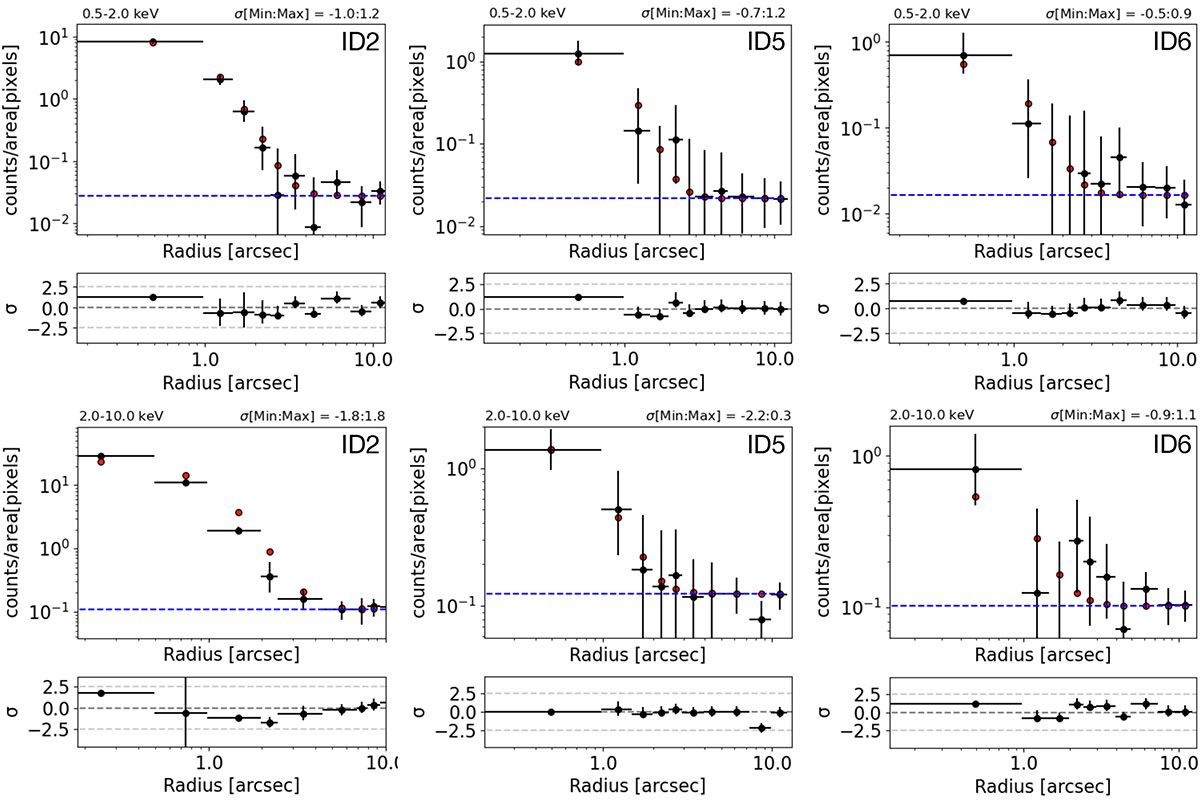
Fig. B.1.
Download original image
Radial profiles of surface counts and residuals, as shown in Figure 1, centred on the AGNs QSO ID2, ID5, and ID6 (from Travascio et al. 2025). The profiles are derived from observational data (black dots) and the simulated PSF (red dots). The top and bottom panels display the profiles in the 0.5-2 keV and 2-10 keV energy bands, respectively.
Current usage metrics show cumulative count of Article Views (full-text article views including HTML views, PDF and ePub downloads, according to the available data) and Abstracts Views on Vision4Press platform.
Data correspond to usage on the plateform after 2015. The current usage metrics is available 48-96 hours after online publication and is updated daily on week days.
Initial download of the metrics may take a while.