


Fig. A.1.
Download original image
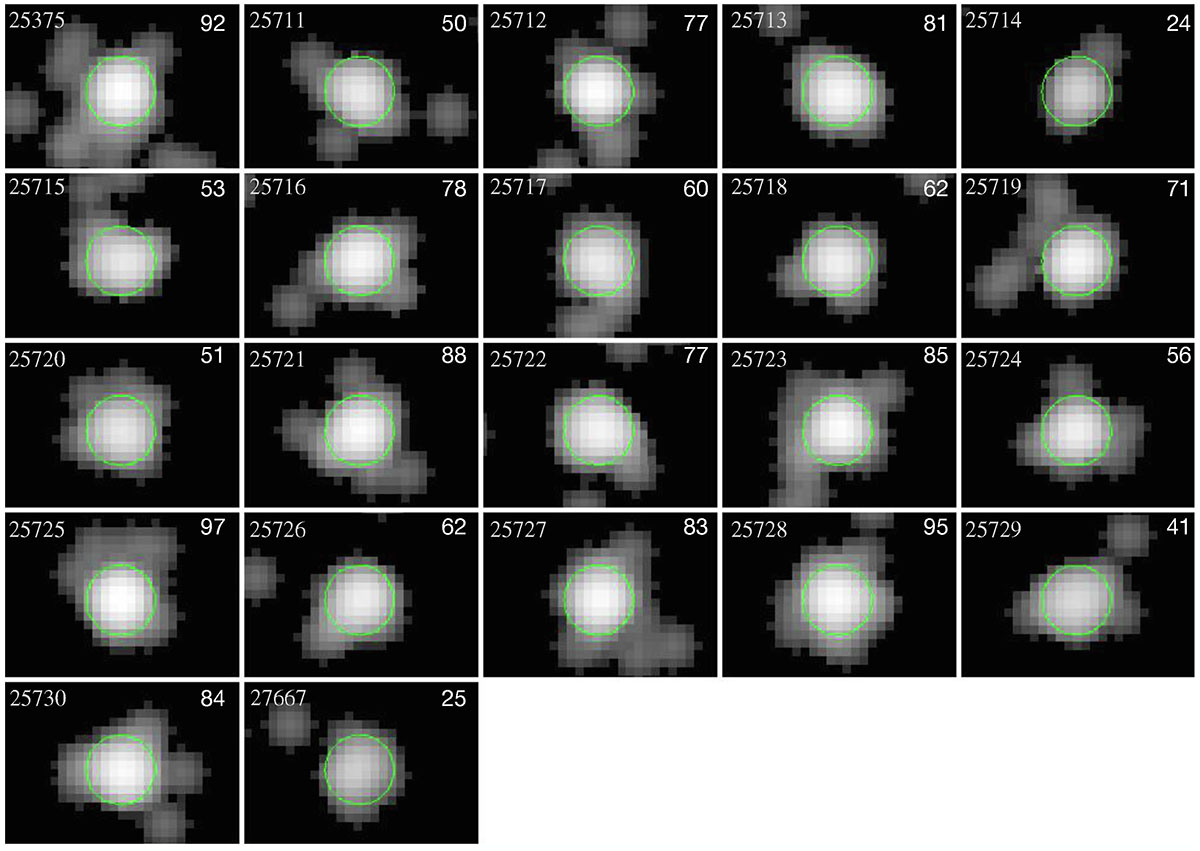
Images at the 0.5-2 keV energy band of all the ObsID (marked on the top left in each panel), centred on the QSO ID1. The images are binned to one-fourth of the native pixel size and smoothed using a Gaussian kernel of 3 sub-pixels. The green 2″ circle indicates the QSO centre, which was used for alignment across observations. The number of counts in the 0.5-2 keV energy band within the 2″ circles is shown on the top right corners in each panel.
Current usage metrics show cumulative count of Article Views (full-text article views including HTML views, PDF and ePub downloads, according to the available data) and Abstracts Views on Vision4Press platform.
Data correspond to usage on the plateform after 2015. The current usage metrics is available 48-96 hours after online publication and is updated daily on week days.
Initial download of the metrics may take a while.