


Fig. 10.
Download original image
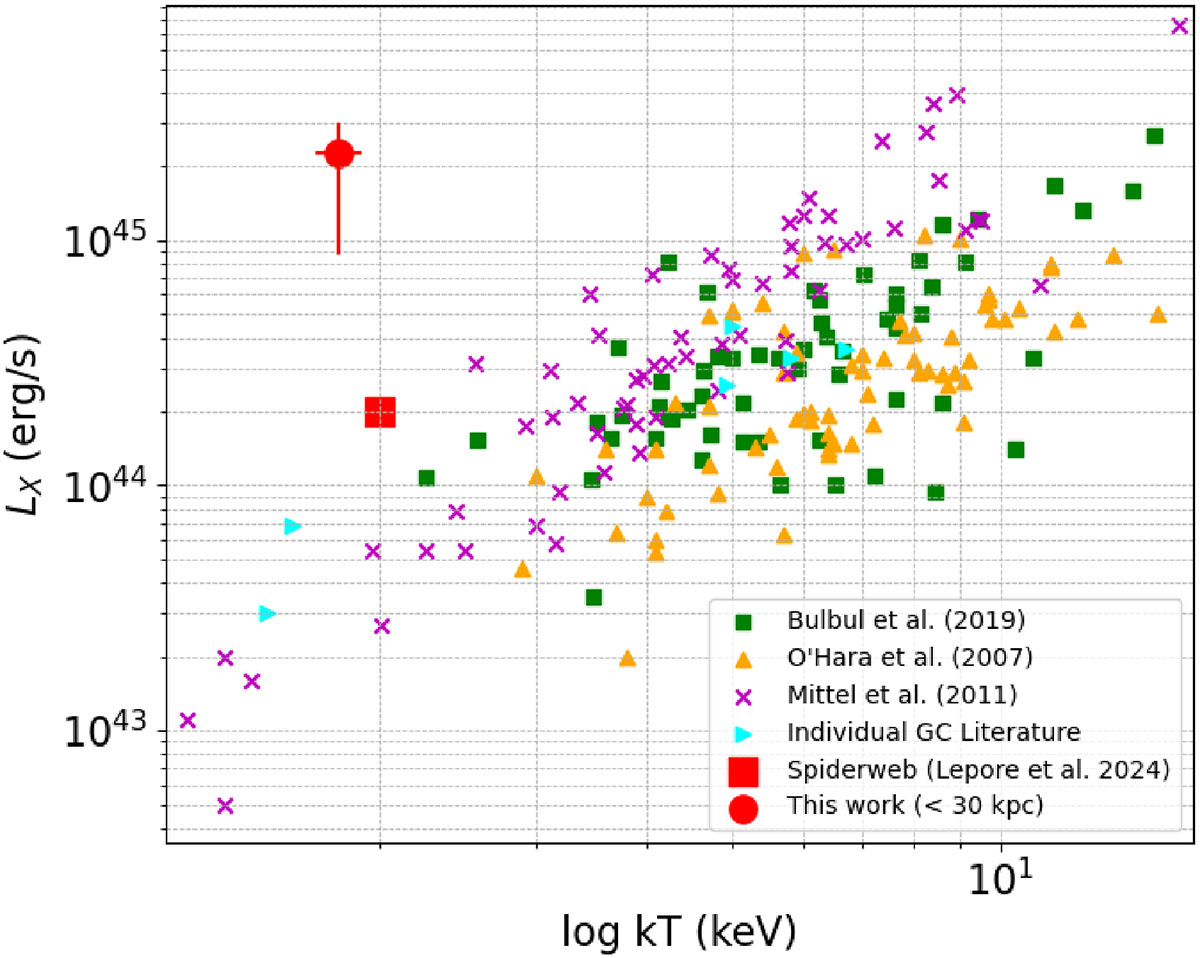
Soft X-ray (0.5–2 keV) luminosity versus temperature kT of the ICM in massive structures across redshift. Symbols show galaxy clusters from Bulbul et al. (2019) (green squares), O’Hara et al. (2007) (orange triangles), Mittal et al. (2011) (magenta crosses), and high-redshift clusters from the literature (cyan triangles; Stanford et al. 2001; Fabian et al. 2001; Mathur & Williams 2003; Andreon & Huertas-Company 2011; Tozzi et al. 2015; Mastromarino et al. 2024). The red square marks the Spiderweb protocluster hot X-ray halo (L24), while the red circle shows the value for the X-ray halo in this work (MQN01) within a radius of 8″, respectively. The background density distributions represent the conservative MCMC posterior accounting for systematics (Section 4.3).
Current usage metrics show cumulative count of Article Views (full-text article views including HTML views, PDF and ePub downloads, according to the available data) and Abstracts Views on Vision4Press platform.
Data correspond to usage on the plateform after 2015. The current usage metrics is available 48-96 hours after online publication and is updated daily on week days.
Initial download of the metrics may take a while.