


Fig. 10.
Download original image
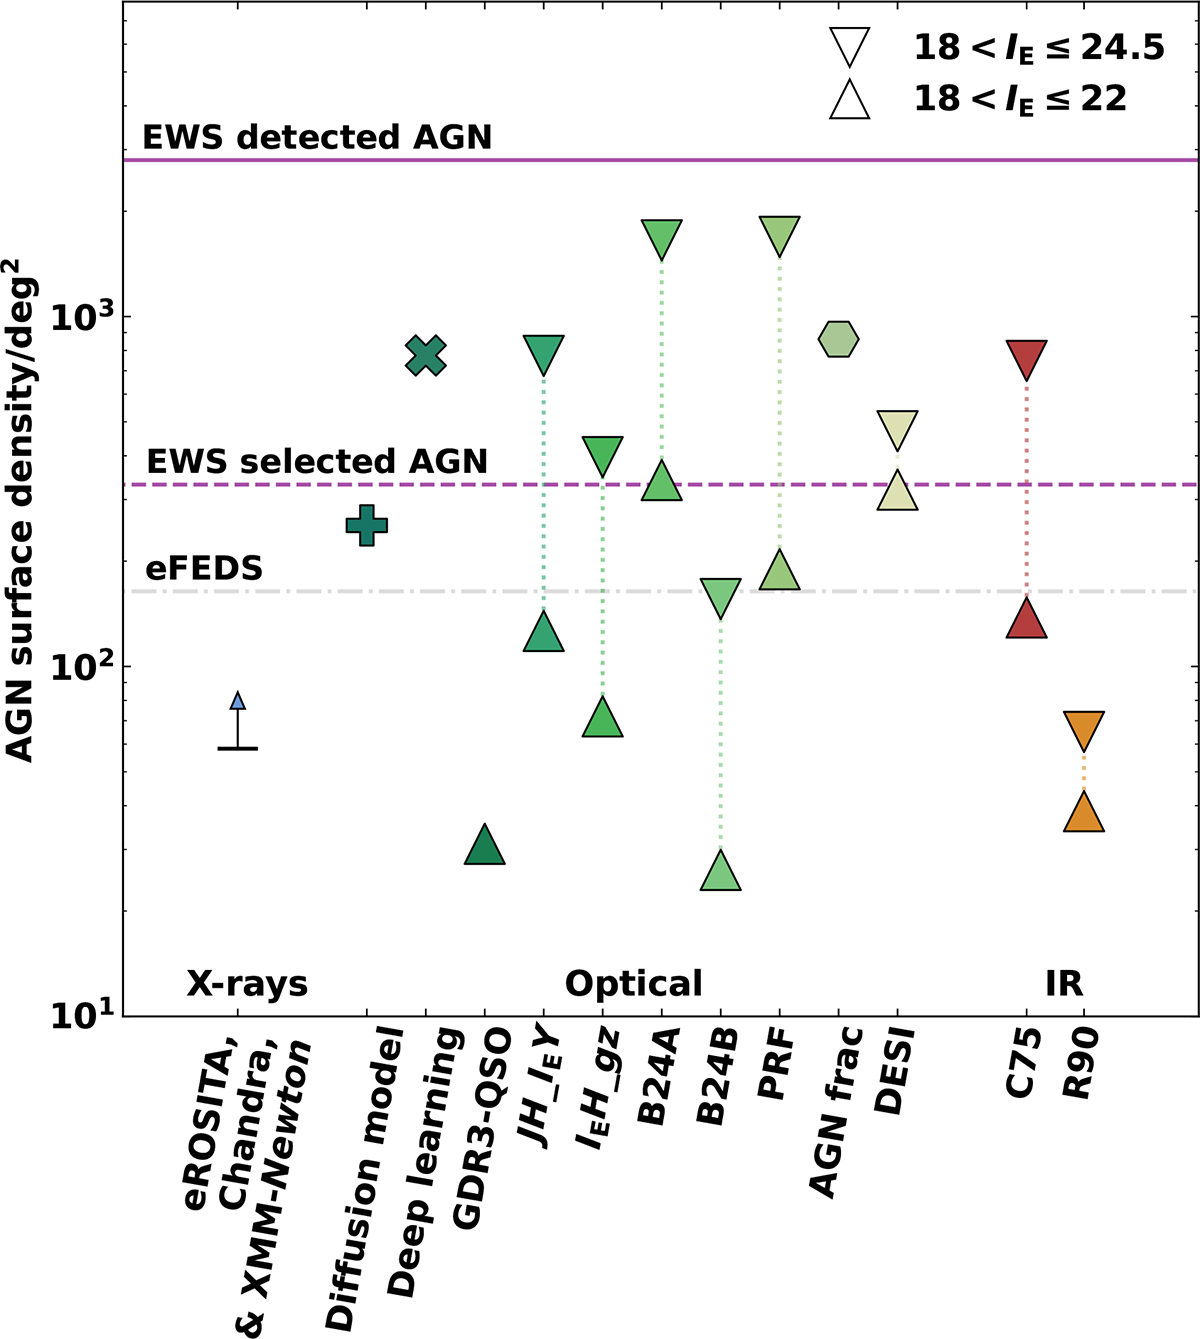
Comparison of AGN surface densities obtained from the selection methods discussed in this work divided into energy bands: X-ray selections (blue), optical selections (shades of green), and IR selections (shades of orange). For the selections B24A, B24B, JH_IEY, IEH_gz, C75, R90, DESI, and PRF, the AGN surface densities are split into 18 < IE ≤ 24.5 (upside down triangles) and 18 < IE ≤ 22 (upside up triangles). For the GDR3-QSOs, only the 18 < IE ≤ 22 is shown due to the limiting magnitude of Gaia. Individual markers indicate AGN surface densities from other Q1 related works, including X-ray candidates from RW25 (with the lower limit indicated by an arrow pointing up); diffusion model candidates from SG25 (plus sign); deep learning candidates from MB25 (cross); and AGN fraction candidates from from LB25 (hexagon). The predictions for the detectable AGN (purple horizontal solid line) and identifiable AGN (purple dashed line) in the EWS from SM25 are included. The grey horizontal dashed line represents recovered AGN surface density by eFEDS (Liu et al. 2022a).
Current usage metrics show cumulative count of Article Views (full-text article views including HTML views, PDF and ePub downloads, according to the available data) and Abstracts Views on Vision4Press platform.
Data correspond to usage on the plateform after 2015. The current usage metrics is available 48-96 hours after online publication and is updated daily on week days.
Initial download of the metrics may take a while.