


Fig. 2.
Download original image
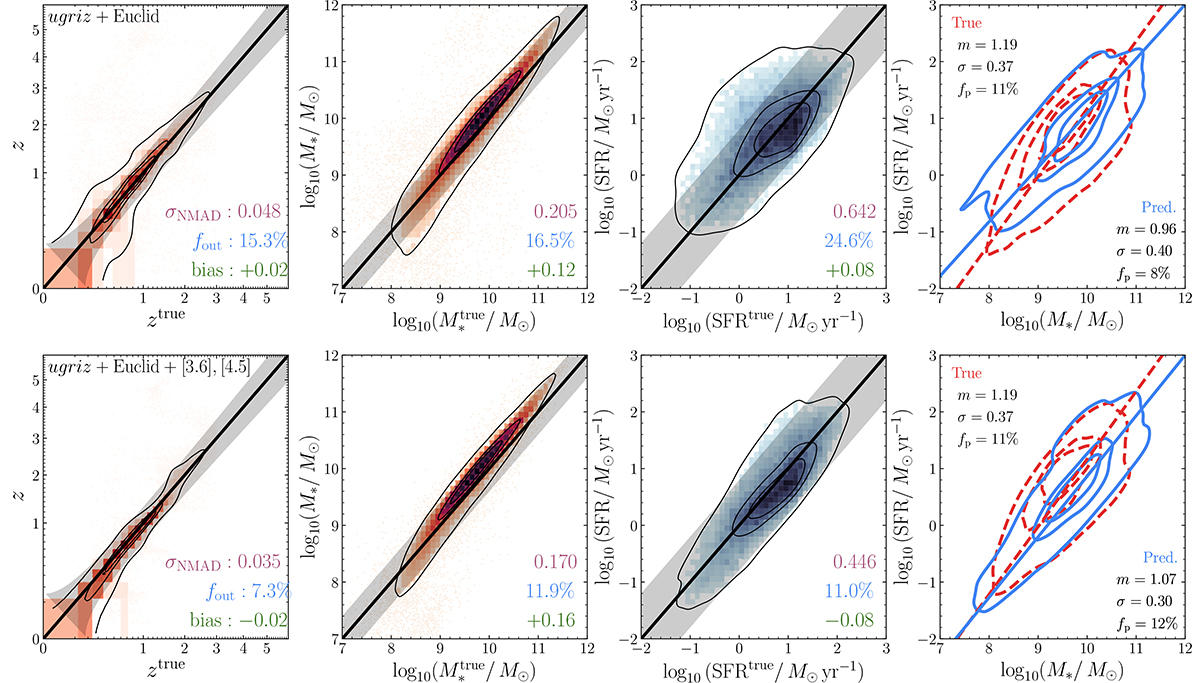
Results for the nnpz run on the 70 k simulated FS2 galaxies, without (top panels) and with the first two WISE filters (bottom panels). The black line is the 1:1 relation; the shaded area is the region beyond which a prediction is an outlier. In every panel, the contours are the area containing 86%, 39% (corresponding to the 2σ and 1σ levels for a 2D histogram), and 20% of the sample. For SFMS (right panel), the true distribution is reported in red (dashed) and the predicted one in blue (solid). The lines are the orthogonal distance regression (ODR) best fit to the distribution with passive galaxies removed. The reported metrics are NMAD (purple), the outlier fraction, fout (blue), and the bias (green) for the photometric redshifts and physical parameters, and the slope, m, scatter, σ, and fraction of passive galaxies, fp, for the SFMS, all defined in Sect. 3.1.
Current usage metrics show cumulative count of Article Views (full-text article views including HTML views, PDF and ePub downloads, according to the available data) and Abstracts Views on Vision4Press platform.
Data correspond to usage on the plateform after 2015. The current usage metrics is available 48-96 hours after online publication and is updated daily on week days.
Initial download of the metrics may take a while.