


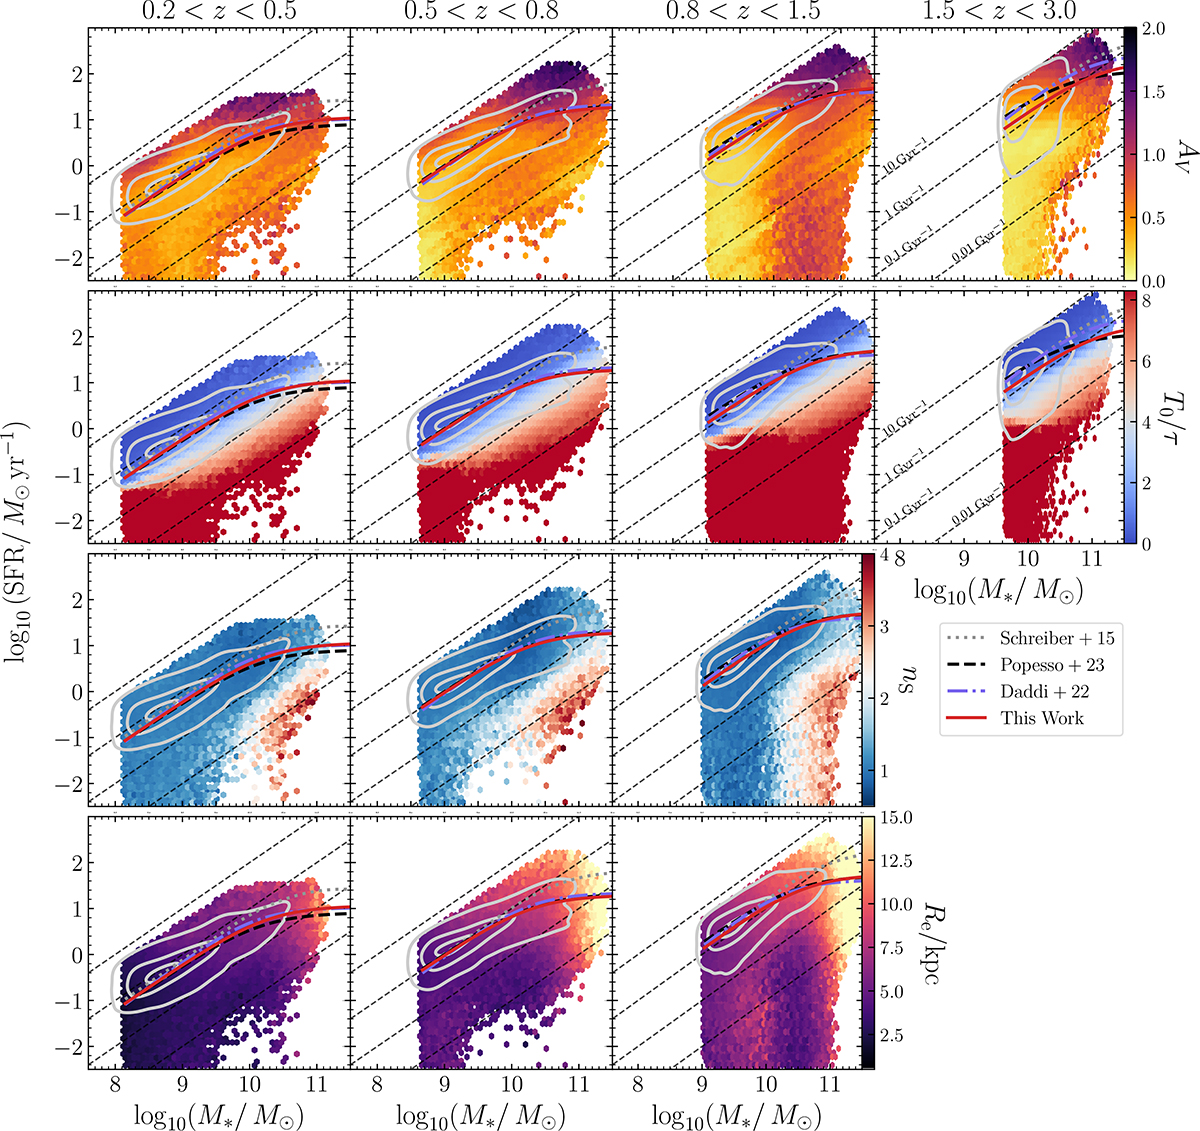
Fig. 12.
Download original image
SFR–M* relation, colour-coded by the median AV (top), T0/τ (middle-top), Sérsic index (middle-bottom), and Sérsic radius (bottom) of objects in each bin. A bin is coloured only when the number of sources falling within the bin is higher than 20. The contours in grey contain 90%, 50%, and 10% of the full sample. The literature SFMS are the same as the ones shown in Fig. 9 and reported in Sect. 4. Dashed lines highlight the loci of equal sSFR.
Current usage metrics show cumulative count of Article Views (full-text article views including HTML views, PDF and ePub downloads, according to the available data) and Abstracts Views on Vision4Press platform.
Data correspond to usage on the plateform after 2015. The current usage metrics is available 48-96 hours after online publication and is updated daily on week days.
Initial download of the metrics may take a while.