


Fig. 12.
Download original image
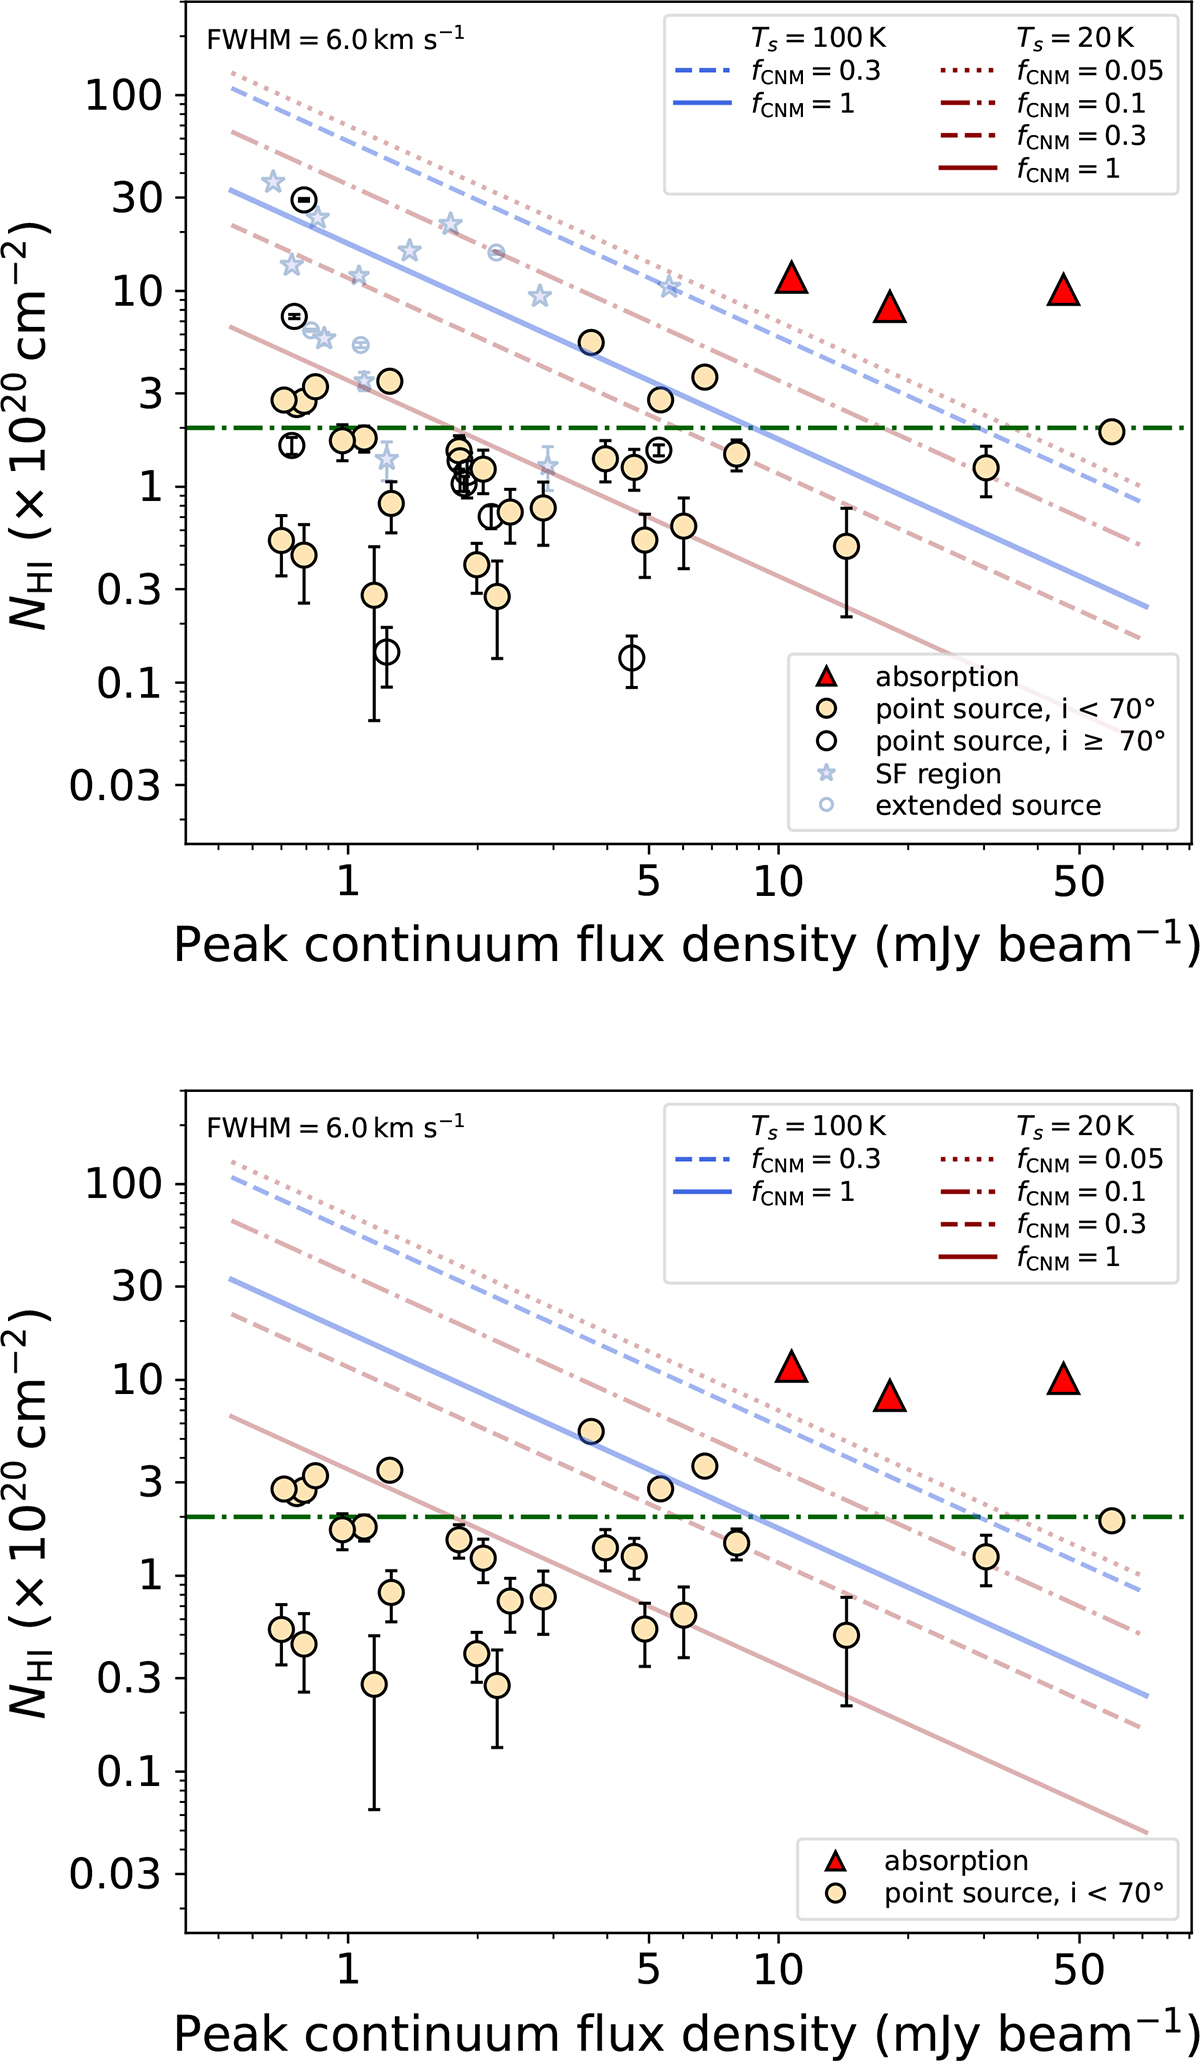
Top: Inclination-corrected H I foreground column density plotted against the peak flux density of the background continuum sources. Red triangles indicate absorption detections. Circles indicate non-detections against unresolved non-Hα sources, filled circles correspond to i < 70°, and open circles correspond to i ≥ 70°. Small stars indicate Hα star-forming regions, and small circles indicate resolved sources not associated with Hα. The filled circles define the ‘clean’ sample of unresolved non-Hα low-inclination sources. The horizontal line marks the Kanekar et al. (2011) threshold at 2 × 1020 cm−2. The dashed diagonal lines show the 3σ absorption detection limits for different Ts and fCNM values. Bottom: same as top, but showing only the clean sample for clarity.
Current usage metrics show cumulative count of Article Views (full-text article views including HTML views, PDF and ePub downloads, according to the available data) and Abstracts Views on Vision4Press platform.
Data correspond to usage on the plateform after 2015. The current usage metrics is available 48-96 hours after online publication and is updated daily on week days.
Initial download of the metrics may take a while.