


Fig. 5.
Download original image
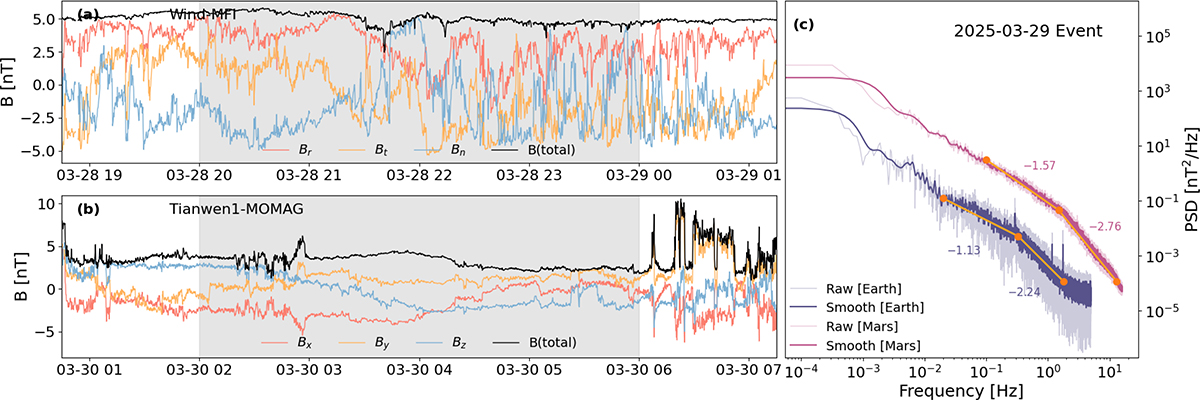
Comparison of the PSD of the magnetic field at Earth and Mars during the SEP event on March 28, 2025. Panels (a) and (b) show the three components of the magnetic field and the total field magnitude observed by Wind (near Earth) and Tianwen-1 (near Mars), respectively. The gray area marks the 4-hour interval (which encompasses the onset time of the SEP event) of the magnetic field data used for the PSD analysis shown in panel (c), where the blue and red lines represent the PSD of magnetic field fluctuations at Earth and Mars, respectively. The orange lines indicate the fitted slopes in the inertial and dissipation ranges, with the corresponding spectral indices labeled nearby.
Current usage metrics show cumulative count of Article Views (full-text article views including HTML views, PDF and ePub downloads, according to the available data) and Abstracts Views on Vision4Press platform.
Data correspond to usage on the plateform after 2015. The current usage metrics is available 48-96 hours after online publication and is updated daily on week days.
Initial download of the metrics may take a while.