


Fig. 2.
Download original image
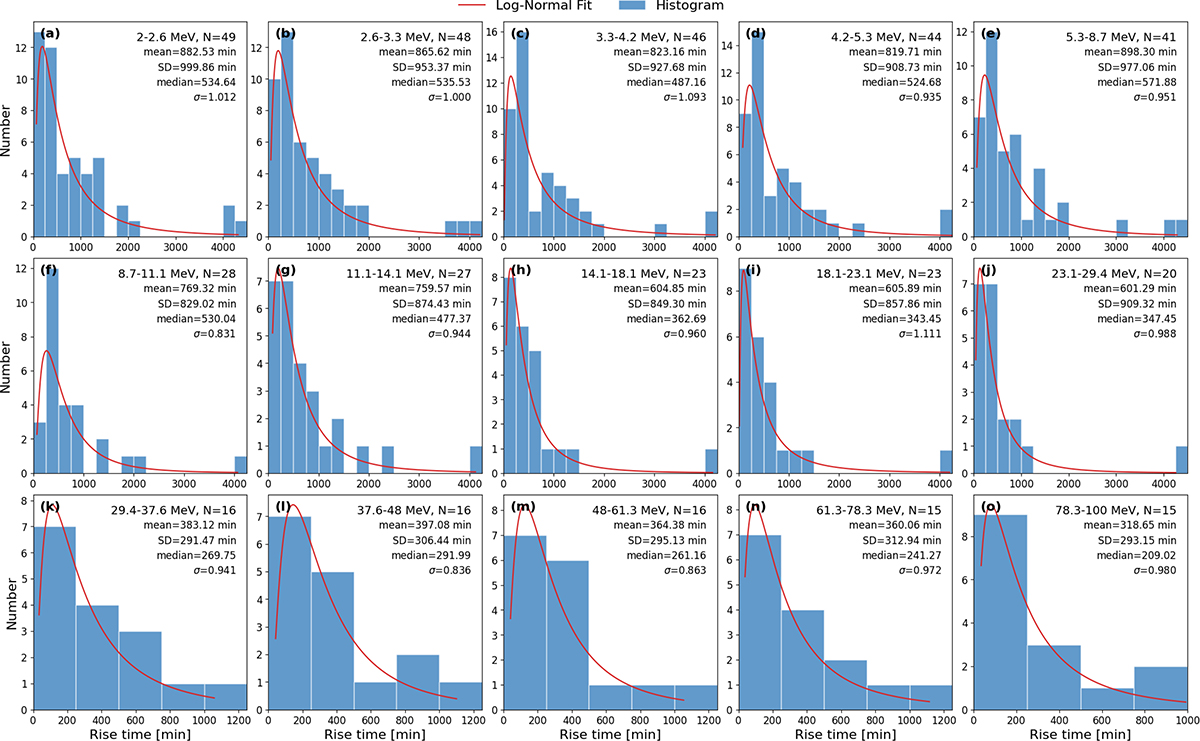
Histograms of the rise times of SEP events observed by the Tianwen-1/MEPA instrument at the orbit of Mars in different energy channels. Panels (a)–(o) correspond to 15 energy intervals spanning 2−100 MeV. In each panel, the blue histogram (bin width fixed at 250 minutes) represents the rise time distributions, while the red curve shows the log-normal fitting of the distribution. The legend in each panel lists the number of events we analyzed, the mean and SD of the observed rise times, and the fitted log-normal parameters with the median and shape parameter defined in Eq. (2).
Current usage metrics show cumulative count of Article Views (full-text article views including HTML views, PDF and ePub downloads, according to the available data) and Abstracts Views on Vision4Press platform.
Data correspond to usage on the plateform after 2015. The current usage metrics is available 48-96 hours after online publication and is updated daily on week days.
Initial download of the metrics may take a while.