


Fig. 1.
Download original image
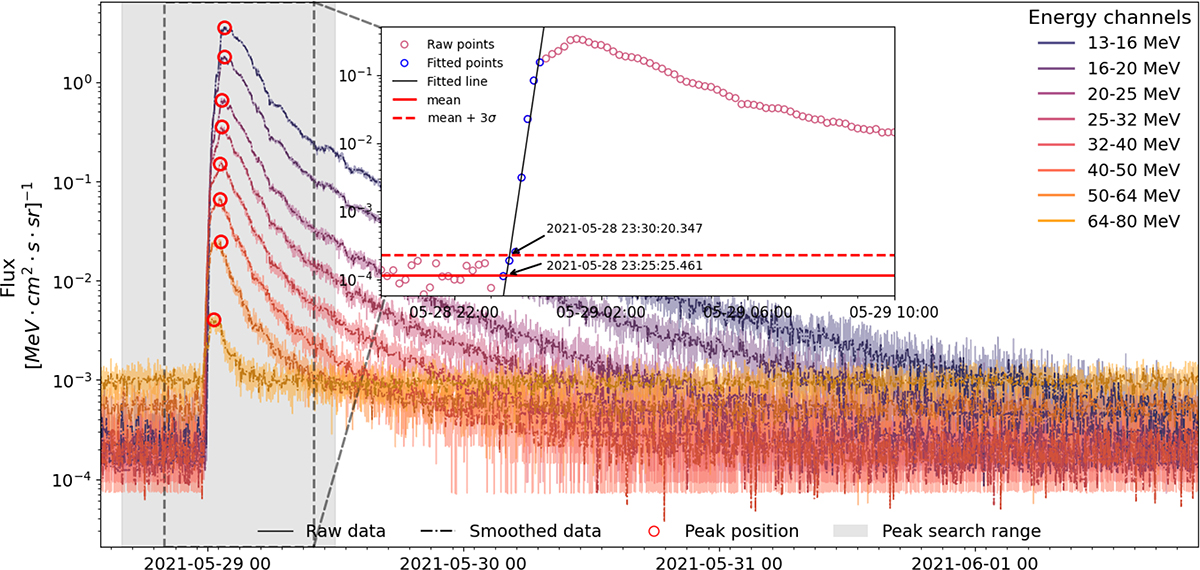
Illustration of the method with which we determined the onset and peak times of an SEP event observed by SOHO/ERNE on May 28, 2021. The main panel shows time-intensity profiles across eight energy ranges (13−100 MeV), where the raw data are plotted as solid lines and the smoothed data are shown as dash-dotted lines. The gray shaded region denotes the search window for the peak identification. Identified peaks are marked by red circles. The inset zooms into the dashed region, displaying the onset determination for the 25−32 MeV range using the linear fitting method. The raw data points are shown as pink circles, and the blue circles represent the data points used for the linear fit. The solid black line shows the fit result. The horizontal red lines indicate the background level (solid line for the mean and dashed line for 3σ). The intersection of the black fitted line with the red background line defines the onset time.
Current usage metrics show cumulative count of Article Views (full-text article views including HTML views, PDF and ePub downloads, according to the available data) and Abstracts Views on Vision4Press platform.
Data correspond to usage on the plateform after 2015. The current usage metrics is available 48-96 hours after online publication and is updated daily on week days.
Initial download of the metrics may take a while.