


| Issue |
A&A
Volume 710, June 2026
|
|
|---|---|---|
| Article Number | L4 | |
| Number of page(s) | 6 | |
| Section | Letters to the Editor | |
| DOI | https://doi.org/10.1051/0004-6361/202660140 | |
| Published online | 28 May 2026 | |
Letter to the Editor
A short-timescale negative optical continuum lag in SDSS J083717.88+191647
Guangxi Key Laboratory for Relativistic Astrophysics, School of Physical Science and Technology, GuangXi University, No. 100, Daxue Road, Nanning 530004, PR China
★ Corresponding author: This email address is being protected from spambots. You need JavaScript enabled to view it.
Received:
30
March
2026
Accepted:
2
May
2026
Abstract
Continuum reverberation mapping (RM) is a powerful technique for constraining the accretion disk structure in active galactic nuclei (AGNs). In typical cases, the shorter-wavelength emission is used as the reference, and a positive time lag is observed since the inner, hotter regions of the accretion disk respond earlier than the cooler outer regions at longer wavelengths. However, we detected a short-timescale negative inter-band lag in SDSS J083717.88+191647 using RM techniques, where the g-band emission lags behind the r-band emission. The light curves from the Zwicky Transient Facility reveal two distinct phases, a stabilizing phase and a declining phase, in which the time lags show opposite signs. Using JAVELIN with the g-band as the reference, we obtained time lags of 3.68+1.94−2.78 days during the stabilizing phase and −1.60+0.69−0.54 days during the declining phase. Although negative continuum lags have been reported in a few previous studies, the present case is distinguished by its clear phase dependence and the accompanying color evolution. We attribute the observed lag reversal to a moving dust-cloud obscuration scenario in which the cloud crossing the line of sight preferentially obscures emission from the outer longer-wavelength regions of the disk, causing the r-band to decline earlier than the g-band and thus producing the observed negative inter-band lag. Our results indicate that AGN variability may be more complex than previously thought. Future high-cadence, multiband observations will be essential to test this dust-obscuration model and to further explore the interplay between the accretion disk emission and dust in AGNs.
Key words: accretion, accretion disks / galaxies: active
© The Authors 2026
 Open Access article, published by EDP Sciences, under the terms of the Creative Commons Attribution License (https://creativecommons.org/licenses/by/4.0), which permits unrestricted use, distribution, and reproduction in any medium, provided the original work is properly cited.
This article is published in open access under the Subscribe to Open model. This email address is being protected from spambots. You need JavaScript enabled to view it. to support open access publication.
1. Introduction
Continuum reverberation mapping (RM), first proposed by Blandford & McKee (1982), is a powerful approach to constraining the disk structure of active galactic nuclei (AGNs). By measuring inter-band time delays in continuum variations, this technique allows one to estimate the characteristic size of the accretion disk (Peterson 1993). Within the framework of the standard Shakura-Sunyaev (SS) disk model (Shakura & Sunyaev 1973), shorter-wavelength emission originating from the hotter, inner regions is expected to lead the longer-wavelength emission produced at larger radii, resulting in observed positive time lags (Tombesi et al. 2007; Goicoechea et al. 2012).
Over the past decade, continuum RM has provided robust measurements of positive inter-band time lags across more than 200 AGNs, with delays typically spanning a few hours to ∼10 days (Cackett et al. 2018, 2021; Miller et al. 2023; Fu et al. 2025). Fian et al. (2023) find positive delays for MCG 08-11-011, with lags of 1.0 ± 0.5, 2.0 ± 0.6, 4.5 ± 0.6, and 7.1 ± 1.1 days across bands from 4250 to 8025 Å, yielding results that are 3−7 times larger than predicted by the SS model. Similar continuum RM studies (e.g., Fausnaugh et al. 2017, 2018; Jha et al. 2022; Jiang et al. 2024; Wang et al. 2025) have also found disk sizes larger than SS-model predictions, possibly due to broad-line region (BLR) diffuse continuum contamination, scattering, or geometric effects. Continuum RM leveraging of these positive time lags has since been extended to other AGN applications, including black hole (BH) mass estimation (Yu et al. 2020; Wang et al. 2023), refined scaling relations (Netzer 2022; Mandal et al. 2025), disk–BLR interactions (Cackett et al. 2022; Panda et al. 2024; Zuo et al. 2024; Jaiswal et al. 2025), and so on.
While previous studies have predominantly focused on positive inter-band lags in AGNs, some intriguing exceptions have emerged. Guo et al. (2022) found negative g − r lags in a small subset of Zwicky Transient Facility (ZTF) AGNs. Negative-lag behavior has also been reported in other AGN lag studies (Lewin et al. 2025). Yao et al. (2023) interpreted the long-timescale negative lag found for Fairall 9 in terms of changes in the accretion-disk vertical structure, and Secunda et al. (2023) have shown through simulations that similar behavior can also arise from structural changes in the accretion flow. These results indicate that negative continuum lags are not rare, and that their physical origins can vary.
In this work we report a short-timescale negative lag between the g- and r-bands in SDSS J083717.88+191647 (hereafter SDSS J0837) using ZTF data. Specifically, during the stabilizing phase, the g-band variations lead the r-band variations, i.e., there is a conventional positive lag, whereas during the declining phase, a negative lag is observed, with the g-band variations lagging behind the r-band variations when the g-band is used as the reference. SDSS J0837 therefore provides a clear example of a phase-dependent lag reversal. We interpret this observation using a moving dust-cloud obscuration scenario.
The remainder of this Letter is organized as follows: Sect. 2 describes the data and results, and Sect. 3 summarizes our conclusions. Throughout the manuscript, we adopt the cosmological parameters H0 = 70 km s−1 Mpc−1, Ωm = 0.3, and ΩΛ = 0.7.
2. Data and results
The photometric data of SDSS J0837 (z = 0.293) were obtained from the ZTF survey1 (Masci et al. 2019; Bellm et al. 2019). They comprise 232 and 363 epochs in the g- and r-bands, respectively (Fig. 1, left panel) over the period MJD 58206–60357. Only measurements with catflags = 0 and programid = 1 were retained, to exclude problematic points and avoid non-uniform sampling. The i-band data were excluded due to sparse sampling and potential Hα contamination (Miller et al. 2023; Mandal et al. 2025). To investigate the source evolution, we examined the g − r color evolution (Fig. 1, left panel inset). The color index remains nearly constant before MJD 59600, indicating a relatively stable phase. Thereafter, pronounced reddening and strong color evolution occur, most likely associated with dust obscuration, underscoring the unusual nature of the source. Dust contamination at longer wavelengths has been reported in Fairall 9 (Mandal et al. 2026), where positive lags have been attributed to disk and dust reprocessing; this indicates that those lags have a different origin than the negative lag observed for SDSS J0837. We separated the variability into two distinct phases: a stabilizing phase before MJD 59600 and a declining phase thereafter. This clear phase division, together with the contemporaneous g − r color evolution, makes SDSS J0837 a useful case for investigating the origin of the lag inversion.
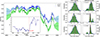 |
Fig. 1. Left panel: Light curves of SDSS J0837 in the g- (green dots) and r-bands (blue dots) overlaid with best-fit JAVELIN models (green and blue shadows). Inset: g − r color evolution, with a vertical line marking MJD 59600. Right panels: Time lag histograms for the stabilizing (top), declining (middle), and entire (bottom) phases. Green bars show the posterior distributions with Gaussian-like fits (blue curves), while dashed red and orange lines indicate the peak positions and 1σ uncertainties, respectively. |
We applied JAVELIN (Zu et al. 2011, 2013, 2016) and the interpolated cross-correlation function (ICCF; Gaskell & Sparke 1986; Gaskell & Peterson 1987; Peterson et al. 1998) to measure inter-band time lags in different phases of the ZTF light curves. The JAVELIN best-fit results are illustrated by the green and blue shadows in Fig. 1, left panel. During the stabilizing phase, JAVELIN detects a positive lag: the g-band leads the r-band by  days. However, this behavior reverses during the declining phase, yielding a lag of
  days, which implies that the r-band variations precede those in the g-band. Our analysis of the entire light curve yielded an intermediate lag of
  days. The ICCF results are qualitatively consistent with this trend, showing lags of
  days,
days,  days, and
  days for the stabilizing, declining, and full phases, respectively. Although the ICCF results have larger uncertainties, likely owing to its sensitivity to irregular sampling, both methods consistently support a transition from a positive to a negative time lag. Given that the cadence of the ZTF light curves is comparable to the measured lag and includes significant gaps, we assessed the impact of the sampling pattern through simulations, finding that sparse sampling and large gaps in the ZTF data do not produce spurious negative lags (see Appendix B).
Motivated by the lag reversal and the g − r color evolution, we propose a moving dust-cloud obscuration scenario. In this picture, a dust cloud crosses the line of sight and progressively obscures the accretion disk. Because the disk emission is radially stratified, the cloud first occults the outer r-band-emitting regions before reaching the inner g-band regions. During the stabilizing phase, when the disk is unobscured, the light curves display the expected positive time lag. In the subsequent “outside-in” occultation phase, however, a geometric time offset is introduced: the r-band flux declines before the g-band flux, naturally giving rise to the observed negative lag.
To model this process, we simulated the intrinsic disk variability using a CAR(1) stochastic process (e.g., Kelly et al. 2009),
 (1)
(1)
where τ is the damping timescale, σ is the variability amplitude, m0 is the mean magnitude, and ϵ(t) is a Gaussian white-noise process. For the intrinsic g-band light curve, we adopted representative parameters of τ = 1000 days, σ = 0.01 mag day−1/2, and m0 = 18.34 mag; the mean magnitude is taken from the average value during the stabilizing phase. We did not adopt the JAVELIN outputs inferred from the observed light curves, as they may be contaminated by the obscuration event. The intrinsic r-band light curve was then constructed from the intrinsic g-band variability through a Gaussian convolution and a magnitude renormalization. Specifically, we convolved the intrinsic g-band light curve with a Gaussian transfer function and imposed an intrinsic time delay of tlag ≈ 3.68 days, consistent with the JAVELIN measurement in the stabilizing phase. Since the JAVELIN analysis gives a transfer-function width close to zero (Fig. A.1), we adopted a narrow kernel with a width of 0.1 days as a numerical approximation to a δ-function response. After the convolution, we subtracted the mean magnitude of the g-band and added that of the r-band, adopting ⟨mr⟩ = 18.18 mag, also derived from the stabilizing phase.
To simulate the obscuration event, we constructed a geometric grid model of the emitting regions, as illustrated schematically in Fig. 2. The model includes concentric emitting regions for the g- and r-bands, with a moving obscuring cloud. The g-band emission extends from Rg,in = 1.0 to Rg,out = 2.0, while the r-band spans Rg,in = 1.3 to Rg,out = 2.5. These emission regions were assumed to be uniform and partially overlapping, which provides a more realistic representation of the emitting structure (e.g., Fausnaugh et al. 2016; Edelson et al. 2019; Lawther et al. 2018; Cackett et al. 2021). To connect the model to physical scales, we adopted a spatial conversion in which 1 unit corresponds to 2.0 light-days. This choice was motivated by the BH mass of SDSS J0837 (109.02 M⊙; Shen et al. 2011), for which 1 Rg ≈ 1.37 light-hours, and ensures that the optical emission regions lie within ∼60 − 100 Rg, consistent with expectations for such a system. Under this scaling, the adopted radial ranges correspond to 2.0−4.0 light-days for the g-band and 2.6−5.0 light-days for the r-band.
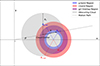 |
Fig. 2. Schematic of the obscuration model. The accretion disk comprises concentric g- (blue, Rg) and r-band (red, Rr) annuli, with their overlap (purple) representing diffuse continuum blending. The obscuring cloud (Rc; dashed gray circle) moves with velocity v along a linear path inclined at angle θ relative to the disk plane (dot-dashed black line). |
As shown in Fig. 2, the obscuring cloud was modeled as a circular, semitransparent structure with a radius of Rc = 3.0 units (6.0 light-days) and a center at (xc, yc). To account for inhomogeneity, we adopted a Gaussian spatial distribution for the color excess E(B − V), representing a centrally concentrated cloud with decreasing density toward the edges. The accretion disk was centered at (Rc + Rr,out, 0) such that the cloud is initially externally tangent to the outer boundary of the disk’s emitting region. The cloud then moves across the disk over 1000 days along a straight trajectory inclined by θ = 10° to the x-axis. The disk emission was discretized on a two-dimensional Cartesian grid with i × j = 400 × 400 cells, where (i, j) denote the grid indices and (xi, yj) the corresponding physical coordinates. At each time step (t), the intrinsic magnitudes, mint(t), are converted to fluxes according to Fint(t) = F0 10−0.4 mint(t), where F0 is the zero-point flux. Since F0 only provides an overall normalization, we set F0 = 1. The resulting flux was then uniformly distributed over the corresponding annulus such that Fpixel(i, j, t) = Fint(t)/Npix, where Npix is the number of grid pixels associated with the corresponding emitting annulus of the accretion disk. A pixel was included in Npix only if more than one-third of its area was covered by the annulus; this choice had a negligible effect on the results. The extinction map was defined as E(B − V)(xi, yj, t) = Epeakexp[−((xi−xc(t))2+(yj−yc(t))2)/σcloud2], where Epeak is the central color excess and σcloud characterizes the spatial extent of the cloud. We adopted Epeak = 0.5 and σcloud = 2.0. The transmission was computed using the Fitzpatrick (1999) extinction law, with coefficients kλ derived from FM_UNRED, such that Tλ(xi, yj, t) = 10−0.4 kλ E(B − V)(xi, yj, t). We note that the alternative extinction curves often adopted for AGNs (e.g., Small Magellanic Cloud-like laws; Hopkins et al. 2004) would mainly rescale the optical attenuation and are therefore unlikely to qualitatively affect the lag behavior. We then obtained the observed flux by summing over all emitting pixels, Fobs(t) = ∑i, jFpixel(i, j, t) Tλ(xi, yj, t), thereby accounting for both geometric overlap and spatially varying extinction. Finally, the flux was converted back to magnitudes as mobs(t) = − 2.5log10[Fobs(t)/F0].
The simulation results are shown in the left panel of Fig. 3. As the obscuration event progresses (t ≳ 500 days), the measured ICCF lag shifts from the intrinsic positive reverberation value to negative values, reaching a minimum around t ∼ 600 days when the outer r-band region is most affected. After the cloud uncovers the central g-band region, the lag increases but remains negative because the extended r-band emission continues to respond earlier. The intrinsic lag is recovered only after the cloud exits the system. The parameter sensitivity, shown in Fig. 3 (right panels), supports an obscuration-driven origin for the lag inversion. Increasing the outer radius of the r-band (Rr,out) and the cloud radius (Rc) enhances the negative lag by increasing the obscuration cross section. Conversely, increasing the inclination angle (θ) weakens the effect by reducing the effective covering of the disk.
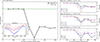 |
Fig. 3. Left panel: Evolution of the measured inter-band time lag as a function of the time span of the analyzed light-curve segment, starting from the onset of the simulated obscuration event. The dashed green line indicates the intrinsic positive lag (+3.68 days). The black points show the measured ICCF lag. Inset: Simulated intrinsic (dashed) and obscured (solid) light curves. Right panels: Effects of varying the r-band outer radius (Rr,out; top), the cloud radius (Rc; middle), and the crossing angle (θ; bottom). The horizontal dashed gray line represents the input intrinsic time lag between the bands. |
An additional factor influencing the measured lag is the degree of radial overlap between the g- and r-band emission regions. A larger overlap reduces the effective spatial separation between the two bands, thereby weakening the differential impact of obscuration. As a result, the induced negative lag is suppressed and the measured lag remains closer to the intrinsic positive value. Conversely, a smaller overlap enhances the radial stratification, allowing the cloud to intercept the outer r-band-dominated region earlier than the more compact g-band emission, which strengthens the negative lag signal. In addition, the numerical resolution of the Cartesian grid affects the precision of the measured lag. In our simulations, a grid size of 400 × 400 is sufficient to ensure convergence, and further increases in resolution do not produce significant changes in the measured lag. We note that the present calculation is based on a single realization for a specific set of stochastic variability parameters. A more comprehensive exploration of the parameter space, including different combinations of σ, τ, Epeak, and σcloud, will be presented in future work.
Our obscuration model is a simplified geometric description of the observed lag. Order-of-magnitude estimates of the cloud properties, provided in Appendix C, show that the proposed scenario is physically plausible for dusty gas in AGNs. We do not attempt to draw firm conclusions about the physical origin, formation mechanism, or detailed spatial structure of the obscuring clouds. We suggest that the anomalous negative lag observed in SDSS J0837 arises from the transit of a dust cloud across the line of sight, which preferentially occults the outer r-band-emitting regions. In this picture, the obscuration is expected to be transient; the cloud may move out of the line of sight on a timescale of a few years, potentially around 2027, allowing the light curve to recover toward its pre-obscuration baseline. Obscuration remains a viable explanation for a small subset of “changing-look” AGNs (Ricci & Trakhtenbrot 2023; Adhikari et al. 2025). Our results are therefore consistent with the possibility that line-of-sight obscuration can still contribute to transient variability in some systems. These results indicate that extrinsic geometric effects, rather than intrinsic changes in the accretion disk, explain the observed short-term lag anomalies and variability in AGNs.
3. Conclusion
We report the detection of a short-timescale negative lag of approximately −1.60 days in the optical continuum of SDSS J0837 between the ZTF g- and r-bands during the declining phase of SDSS J0837. This short-timescale negative inter-band lag, independently confirmed via both the JAVELIN and ICCF methods, together with the positive lag measured during the stabilizing phase, indicates a clear phase-dependent lag reversal. We therefore propose a moving dust-cloud obscuration model in which the cloud transiting the line of sight preferentially attenuates the r-band emission and naturally produces the observed lag inversion.
Acknowledgments
Zhang gratefully thanks the kind financial support from GuangXi University, the HangJi Action Plan under the Guangxi Science and Technology Program 2026GXNSFDA00640018, the kind grant support from NSFC-12373014 and NSFC-12173020, the support from the Guangxi Talent Programme (Highland of Innovation Talents), and the support from the Bagui Scholars Programme (W X G., GXR-6BG2424001). This manuscript has made use of the data from the ZTF survey. The ZTF website is http://irsa.ipac.caltech.edu/
References
- Adhikari, T. P., Mondal, S., He, Z., Rozanska, A., & Hryniewicz, K. 2025, ApJ, 988, 25 [Google Scholar]
- Bellm, E. C., Kulkarni, S. R., Graham, M. J., et al. 2019, PASP, 131, 018002 [Google Scholar]
- Blandford, R. D., & McKee, C. F. 1982, ApJ, 255, 419 [Google Scholar]
- Cackett, E. M., Chiang, C.-Y., McHardy, I., et al. 2018, ApJ, 857, 53 [NASA ADS] [CrossRef] [Google Scholar]
- Cackett, E. M., Bentz, M. C., & Kara, E. 2021, iScience, 24, 102557 [NASA ADS] [CrossRef] [Google Scholar]
- Cackett, E. M., Zoghbi, A., & Ulrich, O. 2022, ApJ, 925, 29 [NASA ADS] [CrossRef] [Google Scholar]
- Czerny, B., & Hryniewicz, K. 2011, A&A, 525, L8 [NASA ADS] [CrossRef] [EDP Sciences] [Google Scholar]
- Edelson, R., Gelbord, J., Cackett, E., et al. 2019, ApJ, 870, 123 [NASA ADS] [CrossRef] [Google Scholar]
- Fausnaugh, M. M., Denney, K. D., Barth, A. J., et al. 2016, ApJ, 821, 56 [Google Scholar]
- Fausnaugh, M. M., Peterson, B. M., Starkey, D. A., Horne, K., & AGN Storm Collaboration 2017, Front. Astron. Space Sci., 4, 55 [NASA ADS] [CrossRef] [Google Scholar]
- Fausnaugh, M. M., Starkey, D. A., Horne, K., et al. 2018, ApJ, 854, 107 [NASA ADS] [CrossRef] [Google Scholar]
- Fian, C., Chelouche, D., Kaspi, S., et al. 2023, A&A, 672, A132 [NASA ADS] [CrossRef] [EDP Sciences] [Google Scholar]
- Fitzpatrick, E. L. 1999, PASP, 111, 63 [Google Scholar]
- Fu, Y.-X., Li, Y.-R., Wang, J.-M., et al. 2025, MNRAS, 543, 2093 [Google Scholar]
- Gaskell, C. M., & Peterson, B. M. 1987, ApJS, 65, 1 [NASA ADS] [CrossRef] [Google Scholar]
- Gaskell, C. M., & Sparke, L. S. 1986, ApJ, 305, 175 [NASA ADS] [CrossRef] [Google Scholar]
- Goicoechea, L. J., Shalyapin, V. N., Gil-Merino, R., & Braga, V. F. 2012, J. Phys. Conf. Ser., 372, 012058 [Google Scholar]
- Guo, H., Barth, A. J., & Wang, S. 2022, ApJ, 940, 20 [NASA ADS] [CrossRef] [Google Scholar]
- Hopkins, P. F., Strauss, M. A., Hall, P. B., et al. 2004, ApJ, 128, 1112 [Google Scholar]
- Jaiswal, V. K., Mandal, A. K., Prince, R., et al. 2025, A&A, 702, A92 [NASA ADS] [CrossRef] [EDP Sciences] [Google Scholar]
- Jha, V. K., Joshi, R., Chand, H., et al. 2022, MNRAS, 511, 3005 [NASA ADS] [CrossRef] [Google Scholar]
- Jiang, Y., Wu, X.-B., Ma, Q., Gu, H., & Wen, Y. 2024, ApJ, 966, 149 [Google Scholar]
- Kelly, B. C., Bechtold, J., & Siemiginowska, A. 2009, ApJ, 698, 895 [Google Scholar]
- Lawther, D., Goad, M. R., Korista, K. T., Ulrich, O., & Vestergaard, M. 2018, MNRAS, 481, 533 [NASA ADS] [CrossRef] [Google Scholar]
- Lewin, C., Kara, E., Panagiotou, C., et al. 2025, ApJ, 993, 245 [Google Scholar]
- Mandal, A. K., Woo, J.-H., & Wang, S. 2025, ApJ, 985, 30 [Google Scholar]
- Mandal, A. K., Nuñez, F. P., Jaiswal, V. K., et al. 2026, A&A, 706, A176 [NASA ADS] [CrossRef] [EDP Sciences] [Google Scholar]
- Masci, F. J., Laher, R. R., Rusholme, B., et al. 2019, PASP, 131, 018003 [Google Scholar]
- Miller, J. A., Cackett, E. M., Goad, M. R., et al. 2023, ApJ, 953, 137 [CrossRef] [Google Scholar]
- Naddaf, M. H., & Czerny, B. 2022, A&A, 663, A77 [NASA ADS] [CrossRef] [EDP Sciences] [Google Scholar]
- Naddaf, M.-H., Czerny, B., & Szczerba, R. 2021, ApJ, 920, 30 [NASA ADS] [CrossRef] [Google Scholar]
- Netzer, H. 2022, MNRAS, 509, 2637 [NASA ADS] [Google Scholar]
- Panda, S., Pozo Nuñez, F., Bañados, E., & Heidt, J. 2024, ApJ, 968, L16 [Google Scholar]
- Peterson, B. M. 1993, PASP, 105, 247 [NASA ADS] [CrossRef] [Google Scholar]
- Peterson, B. M., Wanders, I., Horne, K., et al. 1998, PASP, 110, 660 [Google Scholar]
- Ricci, C., & Trakhtenbrot, B. 2023, Nat. Astron., 7, 1282 [Google Scholar]
- Secunda, A., Greene, J. E., Jiang, Y.-F., Yao, P. Z., & Zoghbi, A. 2023, ApJ, 956, 81 [Google Scholar]
- Shakura, N. I., & Sunyaev, R. A. 1973, A&A, 24, 337 [NASA ADS] [Google Scholar]
- Shen, Y., Richards, G. T., Strauss, M. A., et al. 2011, ApJS, 194, 45 [Google Scholar]
- Tombesi, F., de Marco, B., Iwasawa, K., et al. 2007, A&A, 467, 1057 [NASA ADS] [CrossRef] [EDP Sciences] [Google Scholar]
- Wang, S., Guo, H., & Woo, J.-H. 2023, ApJ, 948, L23 [NASA ADS] [CrossRef] [Google Scholar]
- Wang, Y.-L., Liu, J.-R., & Wang, J.-M. 2025, A&A, 695, A143 [NASA ADS] [CrossRef] [EDP Sciences] [Google Scholar]
- Yao, P. Z., Secunda, A., Jiang, Y.-F., et al. 2023, ApJ, 953, 43 [Google Scholar]
- Yu, Z., Martini, P., Davis, T. M., et al. 2020, ApJS, 246, 16 [Google Scholar]
- Zu, Y., Kochanek, C. S., & Peterson, B. M. 2011, ApJ, 735, 80 [NASA ADS] [CrossRef] [Google Scholar]
- Zu, Y., Kochanek, C. S., Kozłowski, S., & Udalski, A. 2013, ApJ, 765, 106 [NASA ADS] [CrossRef] [Google Scholar]
- Zu, Y., Kochanek, C. S., Kozłowski, S., & Peterson, B. M. 2016, ApJ, 819, 122 [NASA ADS] [CrossRef] [Google Scholar]
- Zuo, W., Guo, H., Sun, J., et al. 2024, ApJ, 974, 288 [Google Scholar]
Appendix A: Posterior distribution of the transfer-function width
Fig. A.1 shows the posterior probability distribution of the transfer-function width obtained from the JAVELIN analysis. The distribution is strongly peaked near zero, indicating that the response between the g- and r-band light curves is consistent with a narrow transfer function.
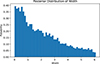 |
Fig. A.1. Posterior probability distribution of the transfer-function width obtained from the JAVELIN RM analysis. |
Appendix B: Sampling properties and their effects on lag measurements
B.1. Cadence properties of the ZTF light curves
We examine the cadence distributions of the g- and r-band light curves, defined as the time intervals between consecutive observations. As shown in Fig. B.1, the median cadence is approximately 3.05 days in the g-band and 2.02 days in the r-band. Most observations are separated by a few days, while the distributions exhibit extended tails toward longer intervals, indicating the presence of occasional large gaps. This confirms that the light curves are characterized by moderately sparse and uneven sampling, which may affect the reliability of lag measurements and therefore motivates the simulation analysis presented below.
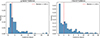 |
Fig. B.1. Cadence distributions of the ZTF light curves. Left: Histogram of the g-band cadence. Right: Histogram of the r-band cadence. In each panel, the dashed red line indicates the median cadence (3.05 days for the g-band, 2.02 days for the r-band). |
B.2. Simulation of sampling effects
To assess whether the observed negative lag could be induced by the sampling pattern, we performed simulations based on a CAR(1) process. We first generated a continuous mock g-band light curve with a time resolution of 0.1 days using CAR(1) process. The corresponding r-band light curve was constructed by introducing a time delay of 3.68 days, ensuring that the intrinsic lag is positive.
The simulated light curves were then resampled using the actual ZTF observation times, thereby preserving both the cadence and the large observational gaps. Observational noise comparable to the ZTF photometric uncertainties was also included.
We computed the lag using the ICCF method. As shown in Fig. B.2 (left panel), the lag recovered from densely sampled light curves is consistent with the input value. After applying the ZTF sampling, the ICCF becomes broader, but the peak remains located at positive lag.
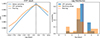 |
Fig. B.2. Left: ICCF results for a representative realization. The blue and orange curves show the results obtained with dense sampling and ZTF-like sampling, respectively. The vertical dashed black line marks the true lag. Right: Distributions of recovered lags from 200 simulations. The blue and orange histograms correspond to the ZTF-sampling case and the declining-phase case, respectively. The vertical dashed red line indicates the true lag. |
We repeated the simulation for 200 independent realizations. The distribution of recovered lags is shown in Fig. B.2 (right panel). All recovered lags remain positive, although the scatter increases under sparse sampling conditions. Similar behavior is found when only the declining phase is considered.
These results suggest that, for the ZTF sampling considered here, sparse sampling, large gaps, and observational noise could be unlikely to produce spurious negative lags, and therefore may not fully account for the observed lag inversion in this dataset.
Appendix C: Physical properties of the obscuring cloud
C.1. Density estimate
We first estimate the characteristic density of the obscuring cloud based on its optical depth. For a dusty medium, the optical depth can be expressed as
 (C.1)
(C.1)
where κdust is the dust opacity, ρ is the mass density, and Rc is the cloud radius.
Assuming a marginal optical depth of τ ∼ 1 in the optical band, a typical dust opacity of κdust ∼ 2.5 × 102 cm2 g−1, and a cloud radius of Rc ∼ 6 light-days, we obtain
 (C.2)
(C.2)
This corresponds to a particle number density of n ∼ 104 cm−3, assuming a mean particle mass appropriate for a partially ionized gas. Although this density is lower than typical values for the BLR, it is consistent with dusty gas located in the outer BLR or participating in radiatively driven outflows, as suggested in the failed radiatively accelerated dusty outflow (FRADO) scenario (Czerny & Hryniewicz 2011; Naddaf et al. 2021; Naddaf & Czerny 2022). This value also lies within the expected range for dusty gas in AGN environments.
C.2. Cloud mass
The total mass of the obscuring cloud can be estimated from its density and size. Assuming a spherical geometry, the cloud mass is given by
 (C.3)
(C.3)
Substituting Rc ∼ 6 light-days and ρ ∼ 10−19 g cm−3, we obtain
 (C.4)
(C.4)
This relatively low mass indicates that the obscuration is produced by a localized and transient structure, rather than a large-scale component of the torus.
C.3. Cloud velocity and physical location
The characteristic velocity of the cloud can be estimated from its crossing timescale. Assuming a crossing time of ∼1000 days over a spatial scale of ∼6 light-days, we obtain
 (C.5)
(C.5)
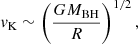
If interpreted as Keplerian motion,
 (C.6)
(C.6)
the inferred velocity vcross ∼ 103 km s−1 would correspond to radii much larger than ∼100 Rg for a BH mass of MBH ∼ 109 M⊙. This suggests that the cloud motion is more plausibly associated with gas located in the outer BLR or near the dust sublimation region, rather than gas orbiting at ∼100 Rg.
The inferred velocity lies within the low-to-intermediate range of BLR kinematics, although it is somewhat higher than typical values associated with the torus. This is consistent with a scenario in which the cloud is located near the outer BLR or the dust sublimation radius, where the BLR is thought to form, as in the FRADO framework.
For high-luminosity AGNs such as SDSS J0837, the dusty structure is expected to be relatively compact in units of Rg, following the scaling relation  . Given that Lbol approximately scales with MBH within a narrow Eddington ratio range, this implies
  , leading to relatively higher characteristic orbital velocities. As a result, transient obscuration by dusty clouds may be more readily observable in AGNs with high BH masses.
All Figures
|
Fig. 1. Left panel: Light curves of SDSS J0837 in the g- (green dots) and r-bands (blue dots) overlaid with best-fit JAVELIN models (green and blue shadows). Inset: g − r color evolution, with a vertical line marking MJD 59600. Right panels: Time lag histograms for the stabilizing (top), declining (middle), and entire (bottom) phases. Green bars show the posterior distributions with Gaussian-like fits (blue curves), while dashed red and orange lines indicate the peak positions and 1σ uncertainties, respectively. |
| In the text | |
|
Fig. 2. Schematic of the obscuration model. The accretion disk comprises concentric g- (blue, Rg) and r-band (red, Rr) annuli, with their overlap (purple) representing diffuse continuum blending. The obscuring cloud (Rc; dashed gray circle) moves with velocity v along a linear path inclined at angle θ relative to the disk plane (dot-dashed black line). |
| In the text | |
|
Fig. 3. Left panel: Evolution of the measured inter-band time lag as a function of the time span of the analyzed light-curve segment, starting from the onset of the simulated obscuration event. The dashed green line indicates the intrinsic positive lag (+3.68 days). The black points show the measured ICCF lag. Inset: Simulated intrinsic (dashed) and obscured (solid) light curves. Right panels: Effects of varying the r-band outer radius (Rr,out; top), the cloud radius (Rc; middle), and the crossing angle (θ; bottom). The horizontal dashed gray line represents the input intrinsic time lag between the bands. |
| In the text | |
|
Fig. A.1. Posterior probability distribution of the transfer-function width obtained from the JAVELIN RM analysis. |
| In the text | |
|
Fig. B.1. Cadence distributions of the ZTF light curves. Left: Histogram of the g-band cadence. Right: Histogram of the r-band cadence. In each panel, the dashed red line indicates the median cadence (3.05 days for the g-band, 2.02 days for the r-band). |
| In the text | |
|
Fig. B.2. Left: ICCF results for a representative realization. The blue and orange curves show the results obtained with dense sampling and ZTF-like sampling, respectively. The vertical dashed black line marks the true lag. Right: Distributions of recovered lags from 200 simulations. The blue and orange histograms correspond to the ZTF-sampling case and the declining-phase case, respectively. The vertical dashed red line indicates the true lag. |
| In the text | |
Current usage metrics show cumulative count of Article Views (full-text article views including HTML views, PDF and ePub downloads, according to the available data) and Abstracts Views on Vision4Press platform.
Data correspond to usage on the plateform after 2015. The current usage metrics is available 48-96 hours after online publication and is updated daily on week days.
Initial download of the metrics may take a while.