


Fig. B.2.
Download original image
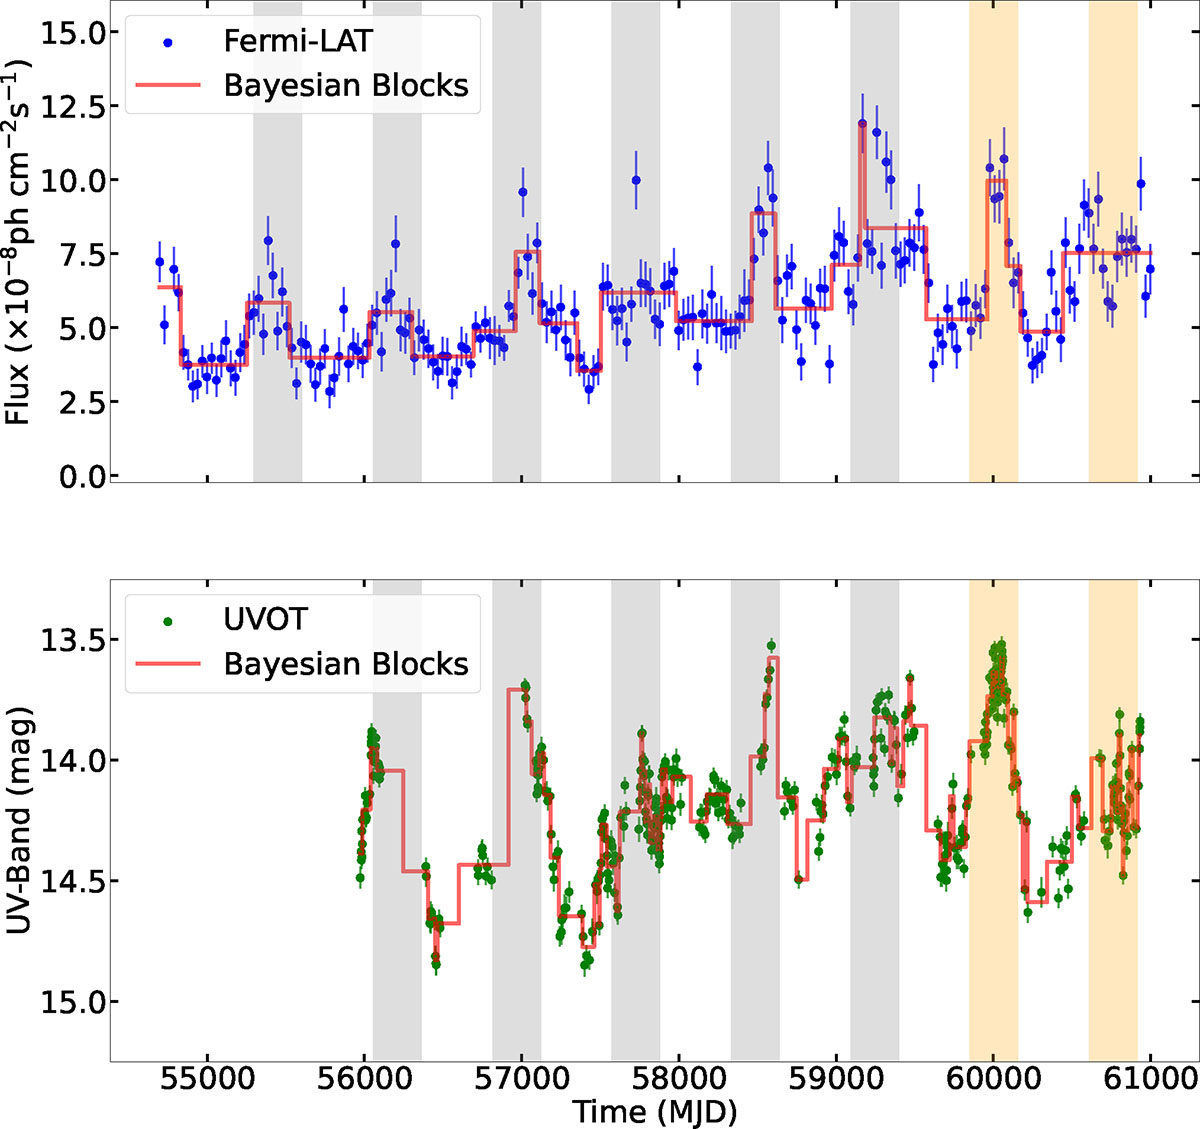
Bayesian blocks of the Fermi-LAT and UVOT (filter "uvv") light curves are shown. The gray vertical lines approximately mark the high-emission states corresponding to the inferred period of ≈2.1 years, while the orange vertical lines approximately indicate the Swift monitoring campaign carried out to track the predicted high states. The figure highlights the near-coincidence of the γ-ray high-emission phase with a similar state observed in UV.
Current usage metrics show cumulative count of Article Views (full-text article views including HTML views, PDF and ePub downloads, according to the available data) and Abstracts Views on Vision4Press platform.
Data correspond to usage on the plateform after 2015. The current usage metrics is available 48-96 hours after online publication and is updated daily on week days.
Initial download of the metrics may take a while.