


Fig. B.1.
Download original image
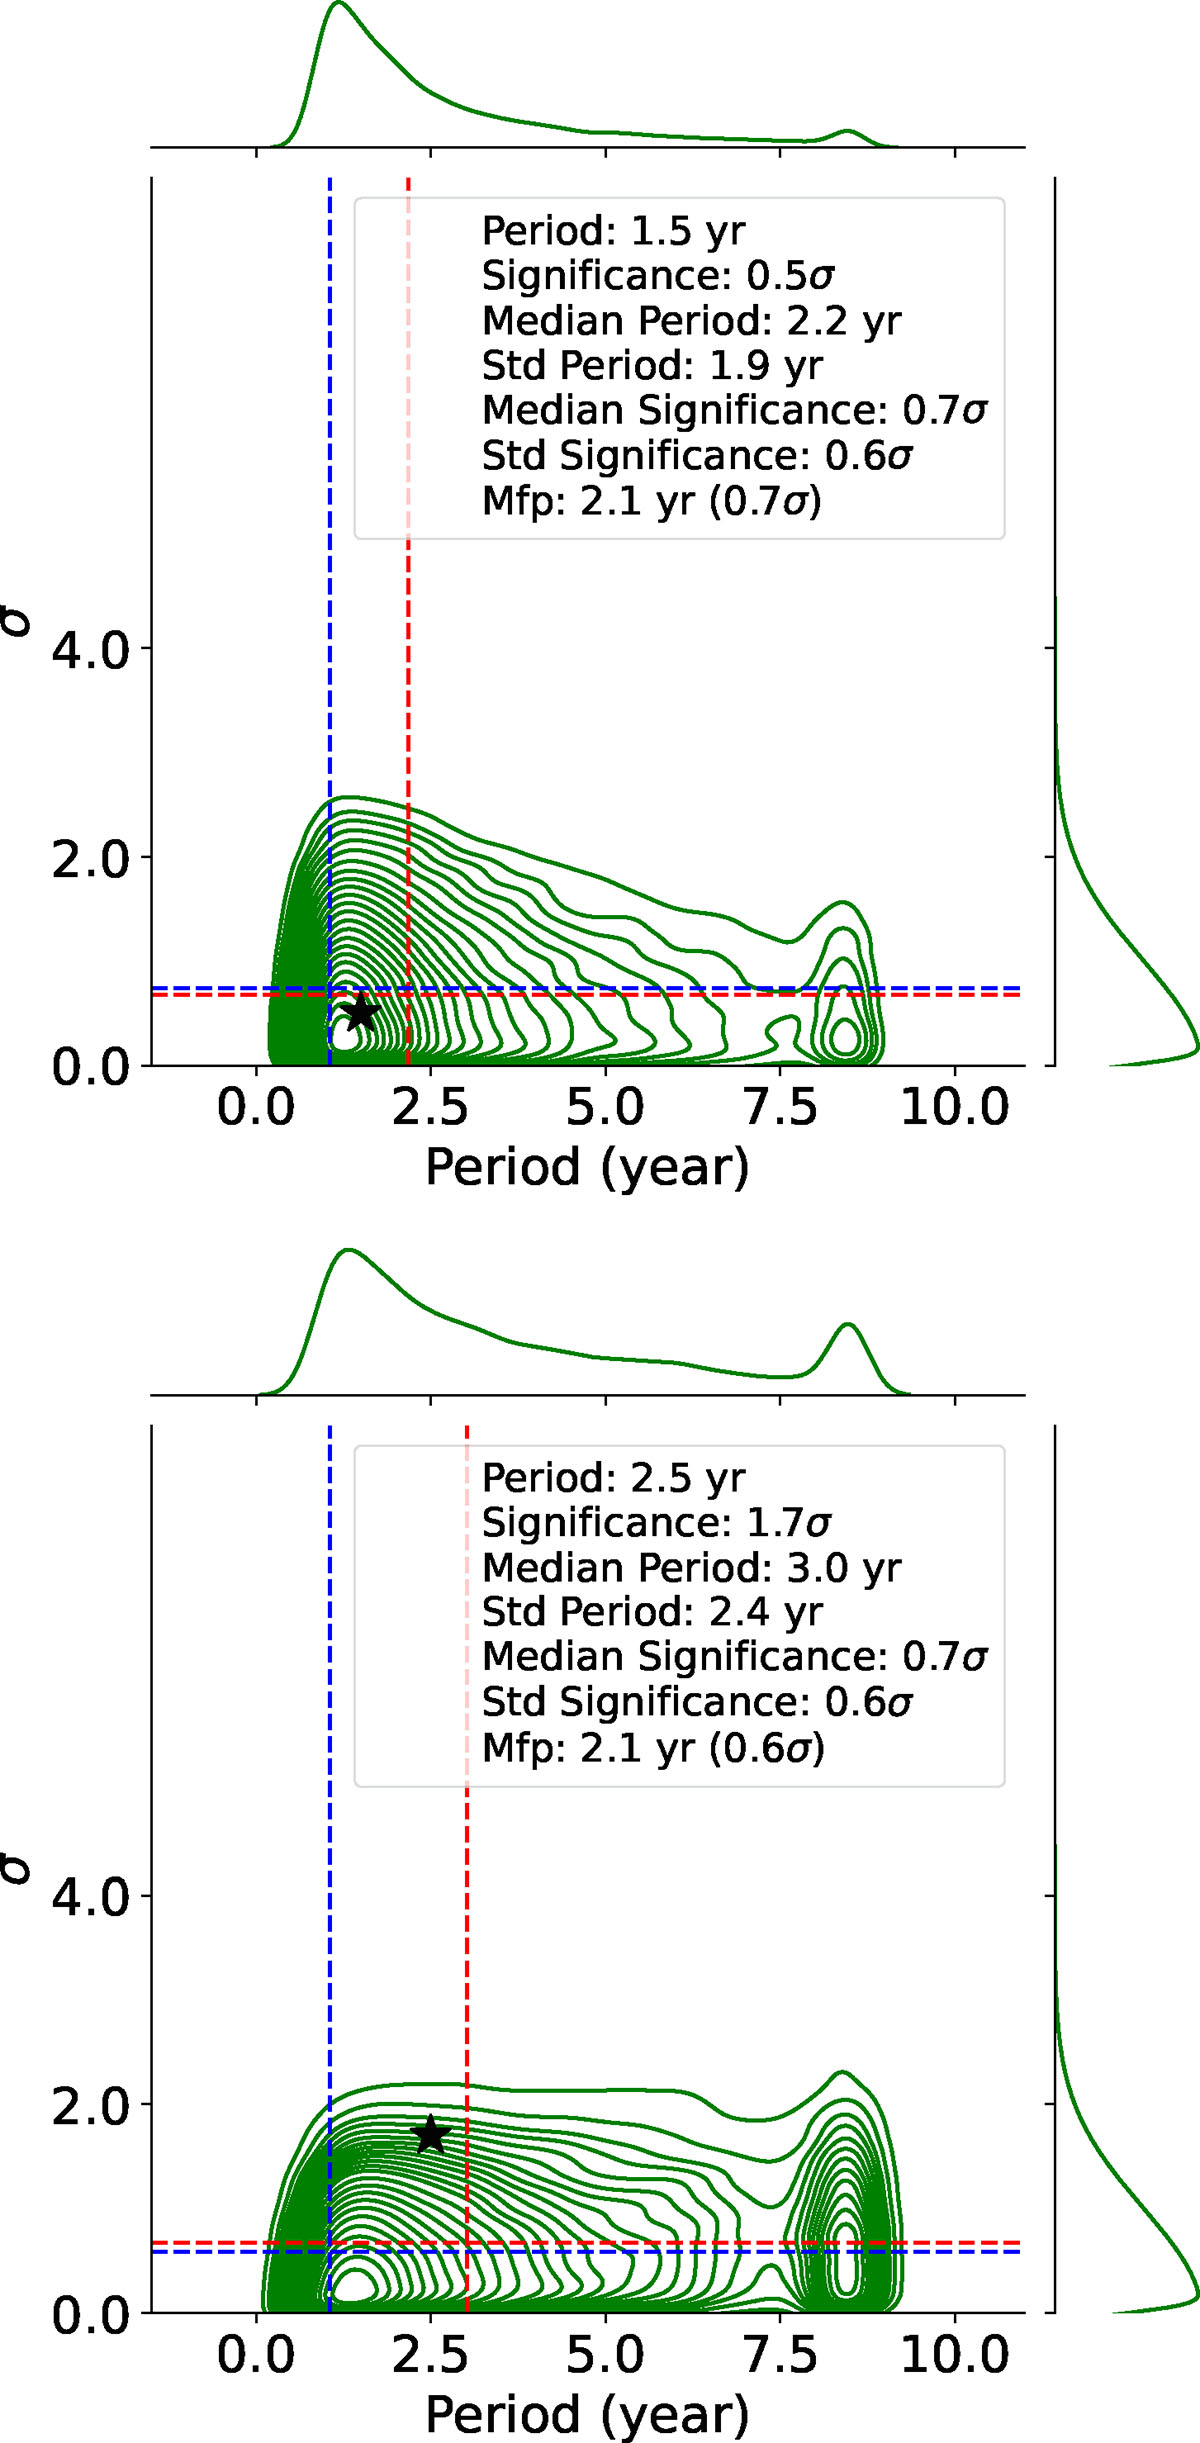
Top: Distributions for the period and significance for the simulated light curves with the same properties as the X-ray data using 100.000 artificial light curves with the same properties as the original light curve (i.e., sampling, gap distribution, PSD, PDF) for the method GLSP. The results denote that the period and significance obtained are compatible with random light curves with the same gap structure as the original X-ray light curve. Bottom: Distributions for the period and significance for the simulated light curves with the same properties as the 30-day binned X-ray data using 100.000 artificial light curves with the same properties as the original light curve (i.e., sampling, gap distribution, PSD, PDF) for the method GLSP. The results indicate that the period and significance recovered from the real data could, in principle, arise from the gap structure, but this scenario is unlikely in the case of the binned light curve. The dotted red vertical and horizontal lines indicate the median values for both the period and the significance of the test. The blue dotted vertical line highlights the most frequently occurring period in the tests (and the associated significance), emphasizing its prominence in the distribution. The “Median Period” represents the median of all periods resulting from the test, and the “Std Period” is the standard deviation of such periods’ distribution. The “Median Significance” represents the median of the significance distribution associated with the test, and the “Std Significance” is the standard deviation of this significance distribution. “Mfp” represents the most frequent period resulting from the test.
Current usage metrics show cumulative count of Article Views (full-text article views including HTML views, PDF and ePub downloads, according to the available data) and Abstracts Views on Vision4Press platform.
Data correspond to usage on the plateform after 2015. The current usage metrics is available 48-96 hours after online publication and is updated daily on week days.
Initial download of the metrics may take a while.