


Fig. 3.
Download original image
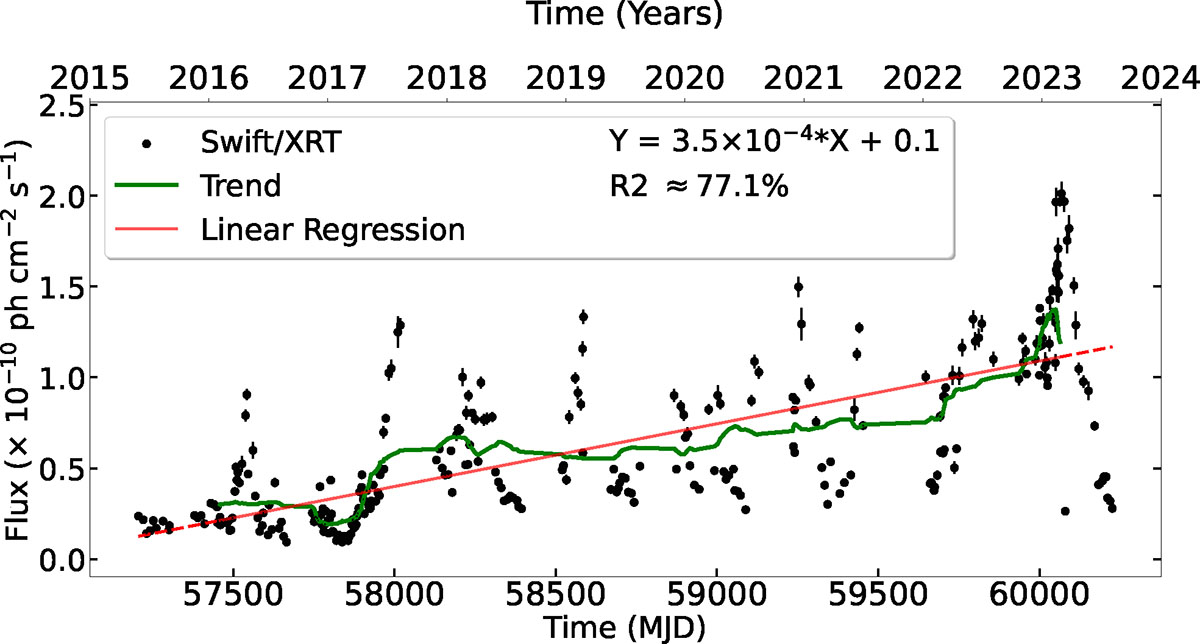
Trend decomposition of the X-ray data. The green line shows the underlying trend extracted using seasonal_decompose. The trend covers a shorter time span than the full light curve duration because of decomposition method. The red line shows the fit to this trend; the dashed red line extends the fit line across the full light curve. The R2 value is 77.2%, indicating a good fit.
Current usage metrics show cumulative count of Article Views (full-text article views including HTML views, PDF and ePub downloads, according to the available data) and Abstracts Views on Vision4Press platform.
Data correspond to usage on the plateform after 2015. The current usage metrics is available 48-96 hours after online publication and is updated daily on week days.
Initial download of the metrics may take a while.