


Fig. 6
Download original image
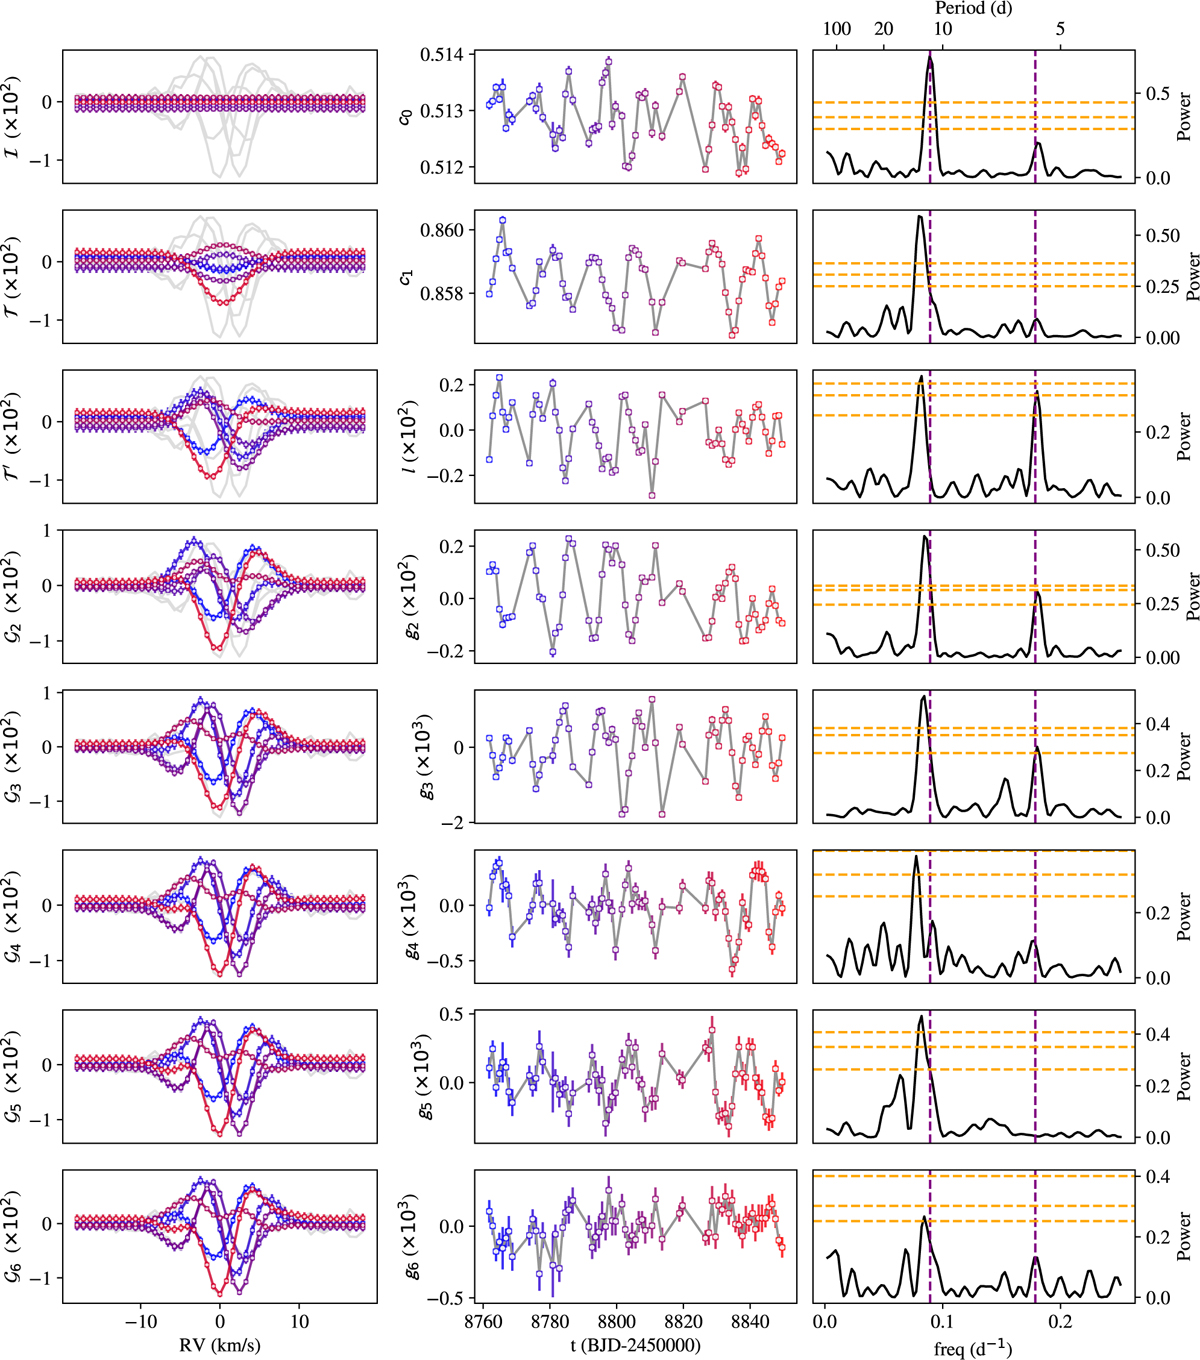
Cross-correlation function decomposition of ϵ Eri with a Hermite basis. Left: contribution of consecutive basis components to the differential CCF reconstruction. We displayed six illustrative epochs randomly selected to visualise the temporal variability of the line-shape distortions. The observed differential CCFs are shown in grey, while the reconstructed components are colour-coded according to the observation time. Middle: time series of the corresponding coefficients. Right: GLS periodograms of the coefficients. The 0.1%, 1%, and 10% FAP levels are indicated in orange, and the stellar rotation period and its first harmonic are marked in purple.
Current usage metrics show cumulative count of Article Views (full-text article views including HTML views, PDF and ePub downloads, according to the available data) and Abstracts Views on Vision4Press platform.
Data correspond to usage on the plateform after 2015. The current usage metrics is available 48-96 hours after online publication and is updated daily on week days.
Initial download of the metrics may take a while.