


Fig. 3
Download original image
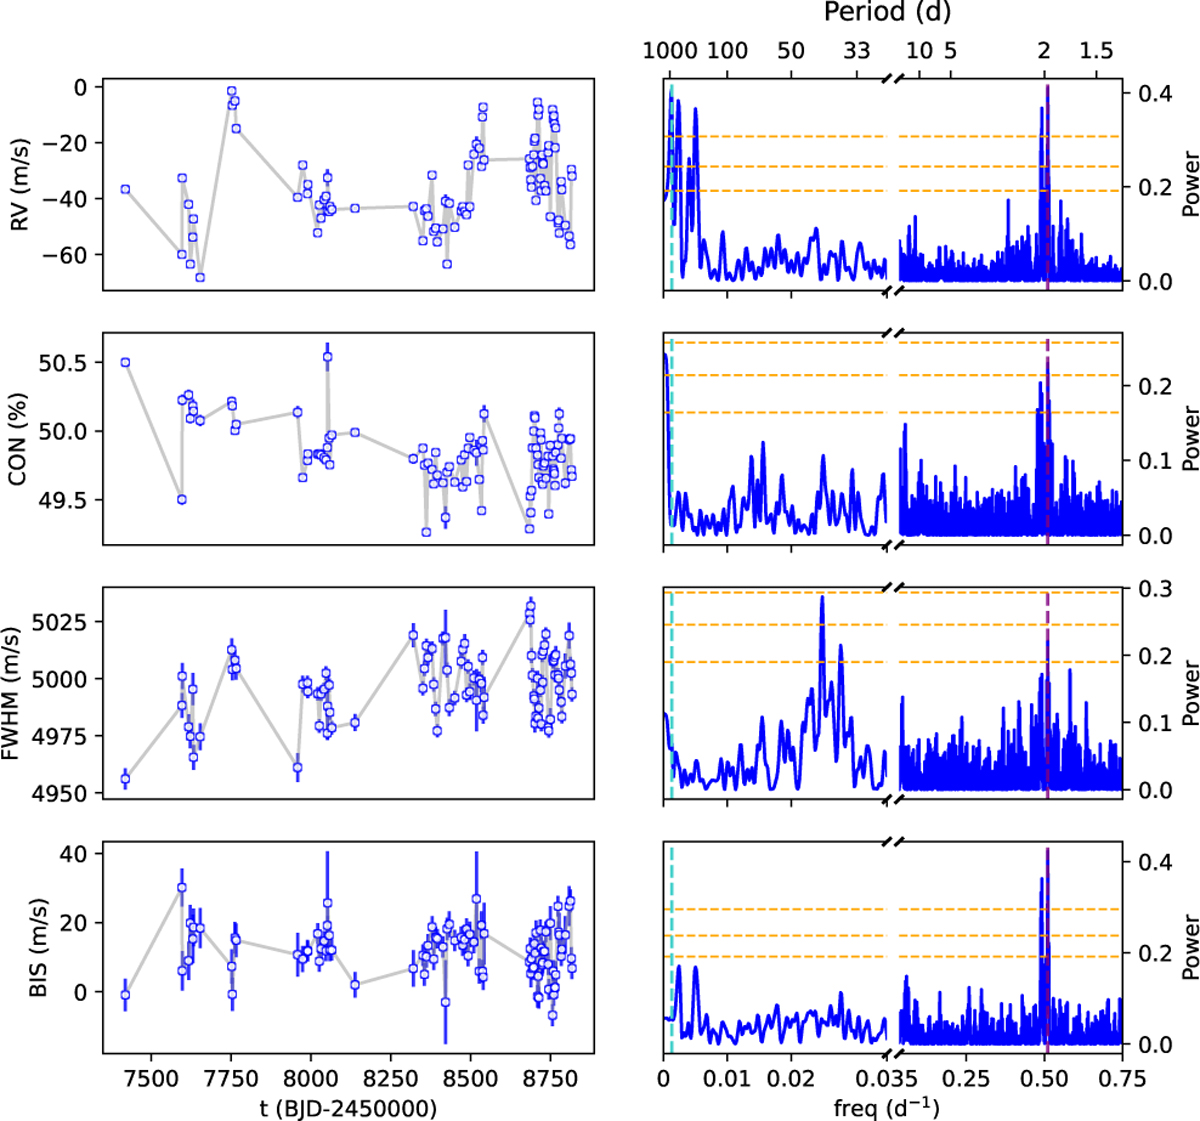
Time series (left) and GLS periodograms (right) of the RV and activity indicators derived from the CCF for TZ Ari. The stellar rotation period (1.96 d) is marked in purple; the planetary orbital period from the literature (722.05 d; Quirrenbach et al. 2022) is marked in light blue; and the 0.1%, 1%, and 10% FAP levels are shown with dashed orange lines. The frequency axis of the periodogram show two scales split at 0.035 d−1 to better visualise long-term variability. The RVs display low-frequency signals associated with the Keplerian motion of TZ Ari b, while the CON and FWHM show lower-frequency stellar activity signals.
Current usage metrics show cumulative count of Article Views (full-text article views including HTML views, PDF and ePub downloads, according to the available data) and Abstracts Views on Vision4Press platform.
Data correspond to usage on the plateform after 2015. The current usage metrics is available 48-96 hours after online publication and is updated daily on week days.
Initial download of the metrics may take a while.