


Fig. 14
Download original image
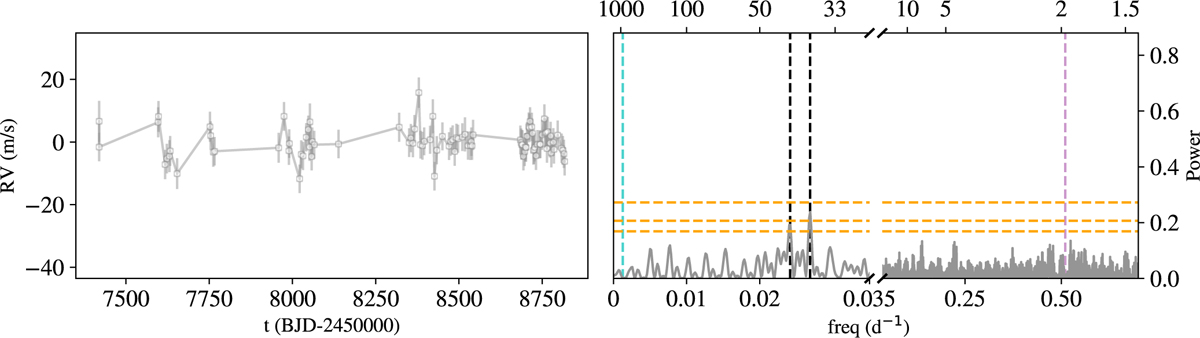
Residual time series (left) and GLS periodogram (right) after subtracting the GP + Keplerian model to the TZ Ari RV data (grey). The 10%, 1%, and 0.1% FAP levels are indicated by dashed orange lines. The stellar rotation period (1.96 d) is shown in purple, the newly derived planetary orbital period (789.92 d) is in light blue, and the two signals exceeding the 1% FAP level (37.2 d and 41.4 d) are marked in black. These likely correspond to stellar activity given the significant (40.18 d) periodicity observed in the FWHM and g2 indicators.
Current usage metrics show cumulative count of Article Views (full-text article views including HTML views, PDF and ePub downloads, according to the available data) and Abstracts Views on Vision4Press platform.
Data correspond to usage on the plateform after 2015. The current usage metrics is available 48-96 hours after online publication and is updated daily on week days.
Initial download of the metrics may take a while.