


Open Access
Fig. 12.
Download original image
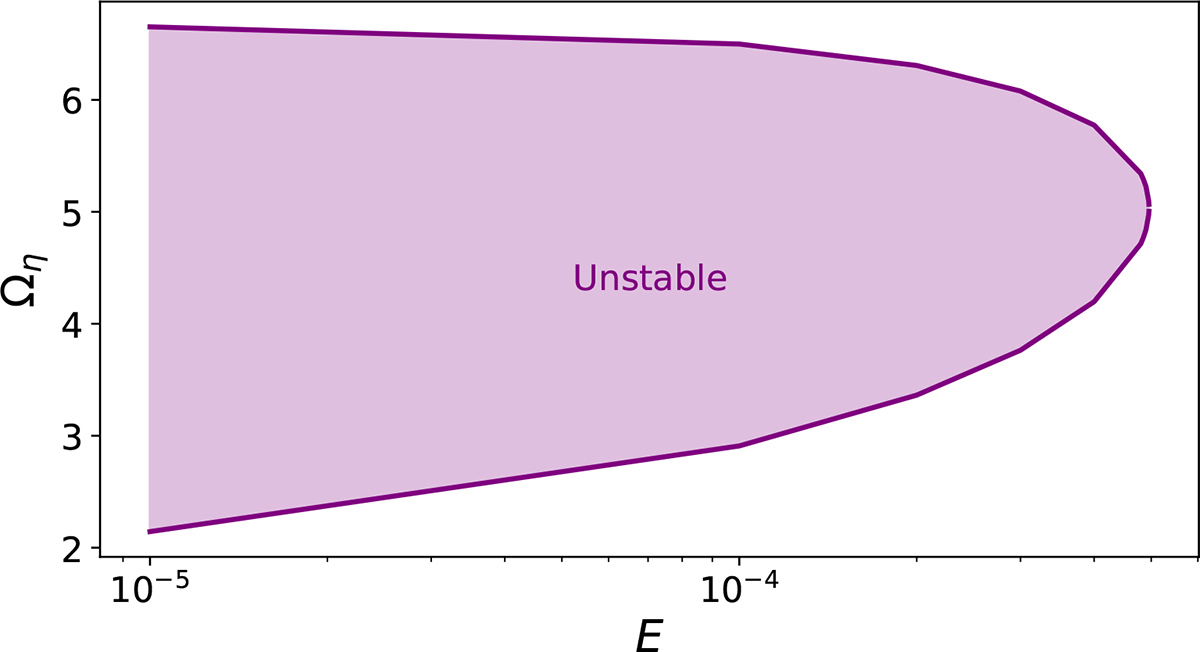
Stability diagram of the m = 5 Kelvin mode at η = 0.18 and γ = 2. The purple region denotes the unstable domain in the explored parameter space and forms a single connected region. The instability does not exist beyond a critical Ekman number E ≈ 5 × 10⁻⁴.
Current usage metrics show cumulative count of Article Views (full-text article views including HTML views, PDF and ePub downloads, according to the available data) and Abstracts Views on Vision4Press platform.
Data correspond to usage on the plateform after 2015. The current usage metrics is available 48-96 hours after online publication and is updated daily on week days.
Initial download of the metrics may take a while.