


Fig. 3.
Download original image
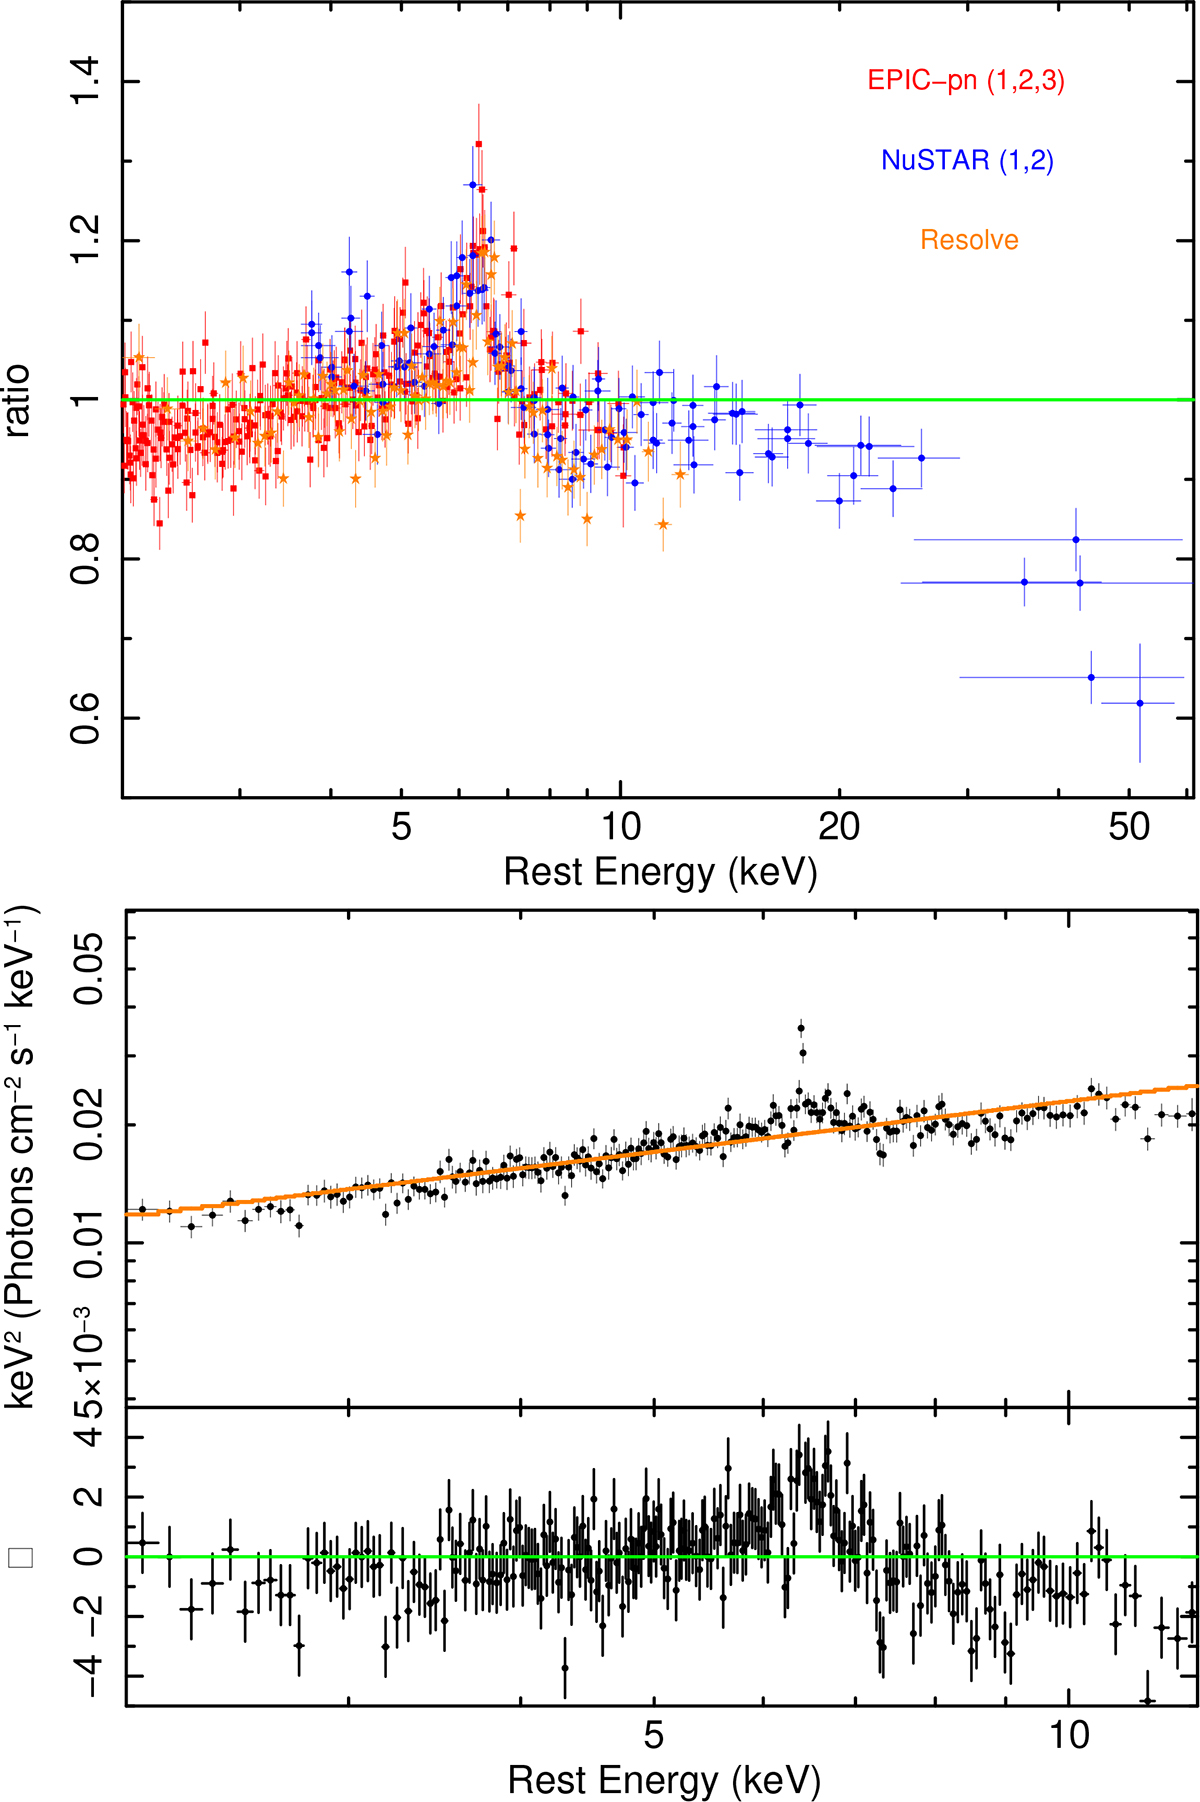
Upper panel: 2–60 keV ratio between the data and a simple power-law model for the Mrk 509 X-ray data taken during this campaign (see Table 1), expressed in units of standard deviations. Here, for clarity purposes, the data have been strongly rebinned (each data point has a 25σ significance). Lower panel: 2–12 keV spectrum of Mrk 509 observed by XRISM/Resolve. The orange line represents the best fit using a simple power-law model. In this case, the Resolve data have also been rebinned (each data point here has a significance of 15σ) for visual clarity.
Current usage metrics show cumulative count of Article Views (full-text article views including HTML views, PDF and ePub downloads, according to the available data) and Abstracts Views on Vision4Press platform.
Data correspond to usage on the plateform after 2015. The current usage metrics is available 48-96 hours after online publication and is updated daily on week days.
Initial download of the metrics may take a while.