


Fig. 12.
Download original image
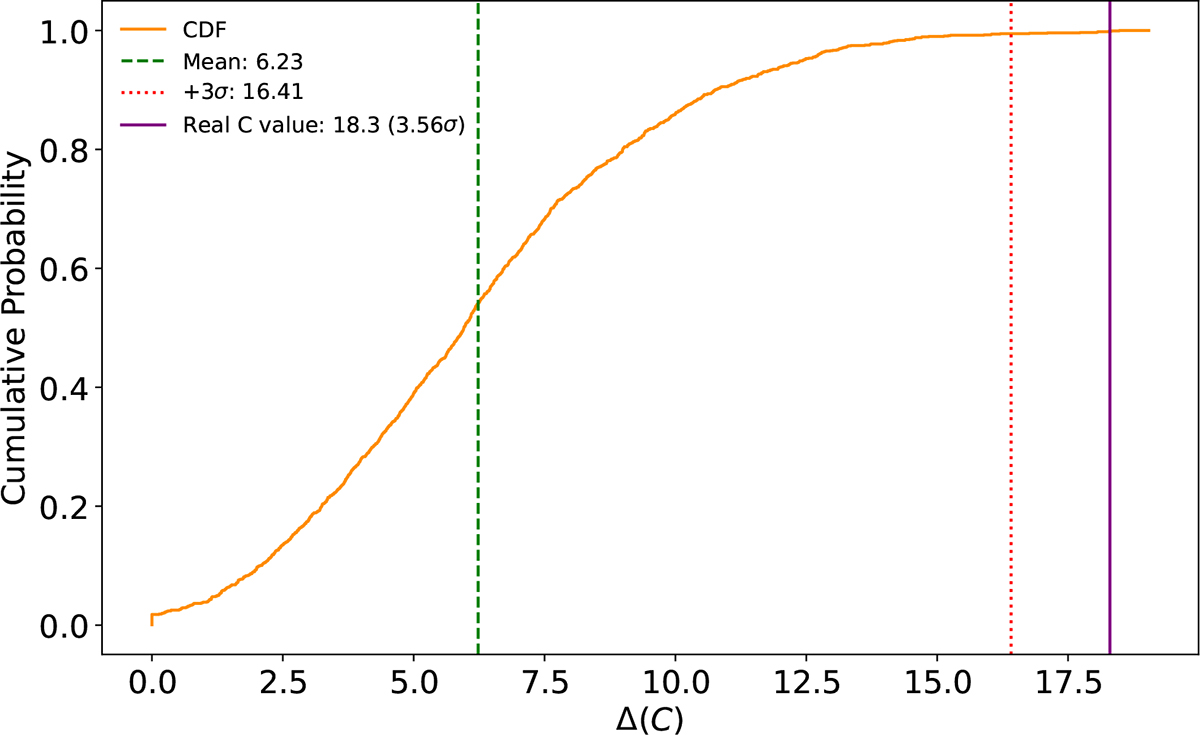
Cumulative distribution of the ΔC statistic derived from 1500 Monte Carlo simulations, assuming Model I (see Table 2) as the null hypothesis. Synthetic XRISM/Resolve spectra were generated matching the exposure time of the real observation. For each simulation, ΔC is defined as the difference in the C-statistic between the best fits obtained modeling the simulated datasets with Model I and Model n8 in Table 2. The vertical green line indicates the mean simulated ΔC, while the red line marks the 3σ confidence threshold. The purple line represents the ΔC value observed in the real data.
Current usage metrics show cumulative count of Article Views (full-text article views including HTML views, PDF and ePub downloads, according to the available data) and Abstracts Views on Vision4Press platform.
Data correspond to usage on the plateform after 2015. The current usage metrics is available 48-96 hours after online publication and is updated daily on week days.
Initial download of the metrics may take a while.