


Fig. 7
Download original image
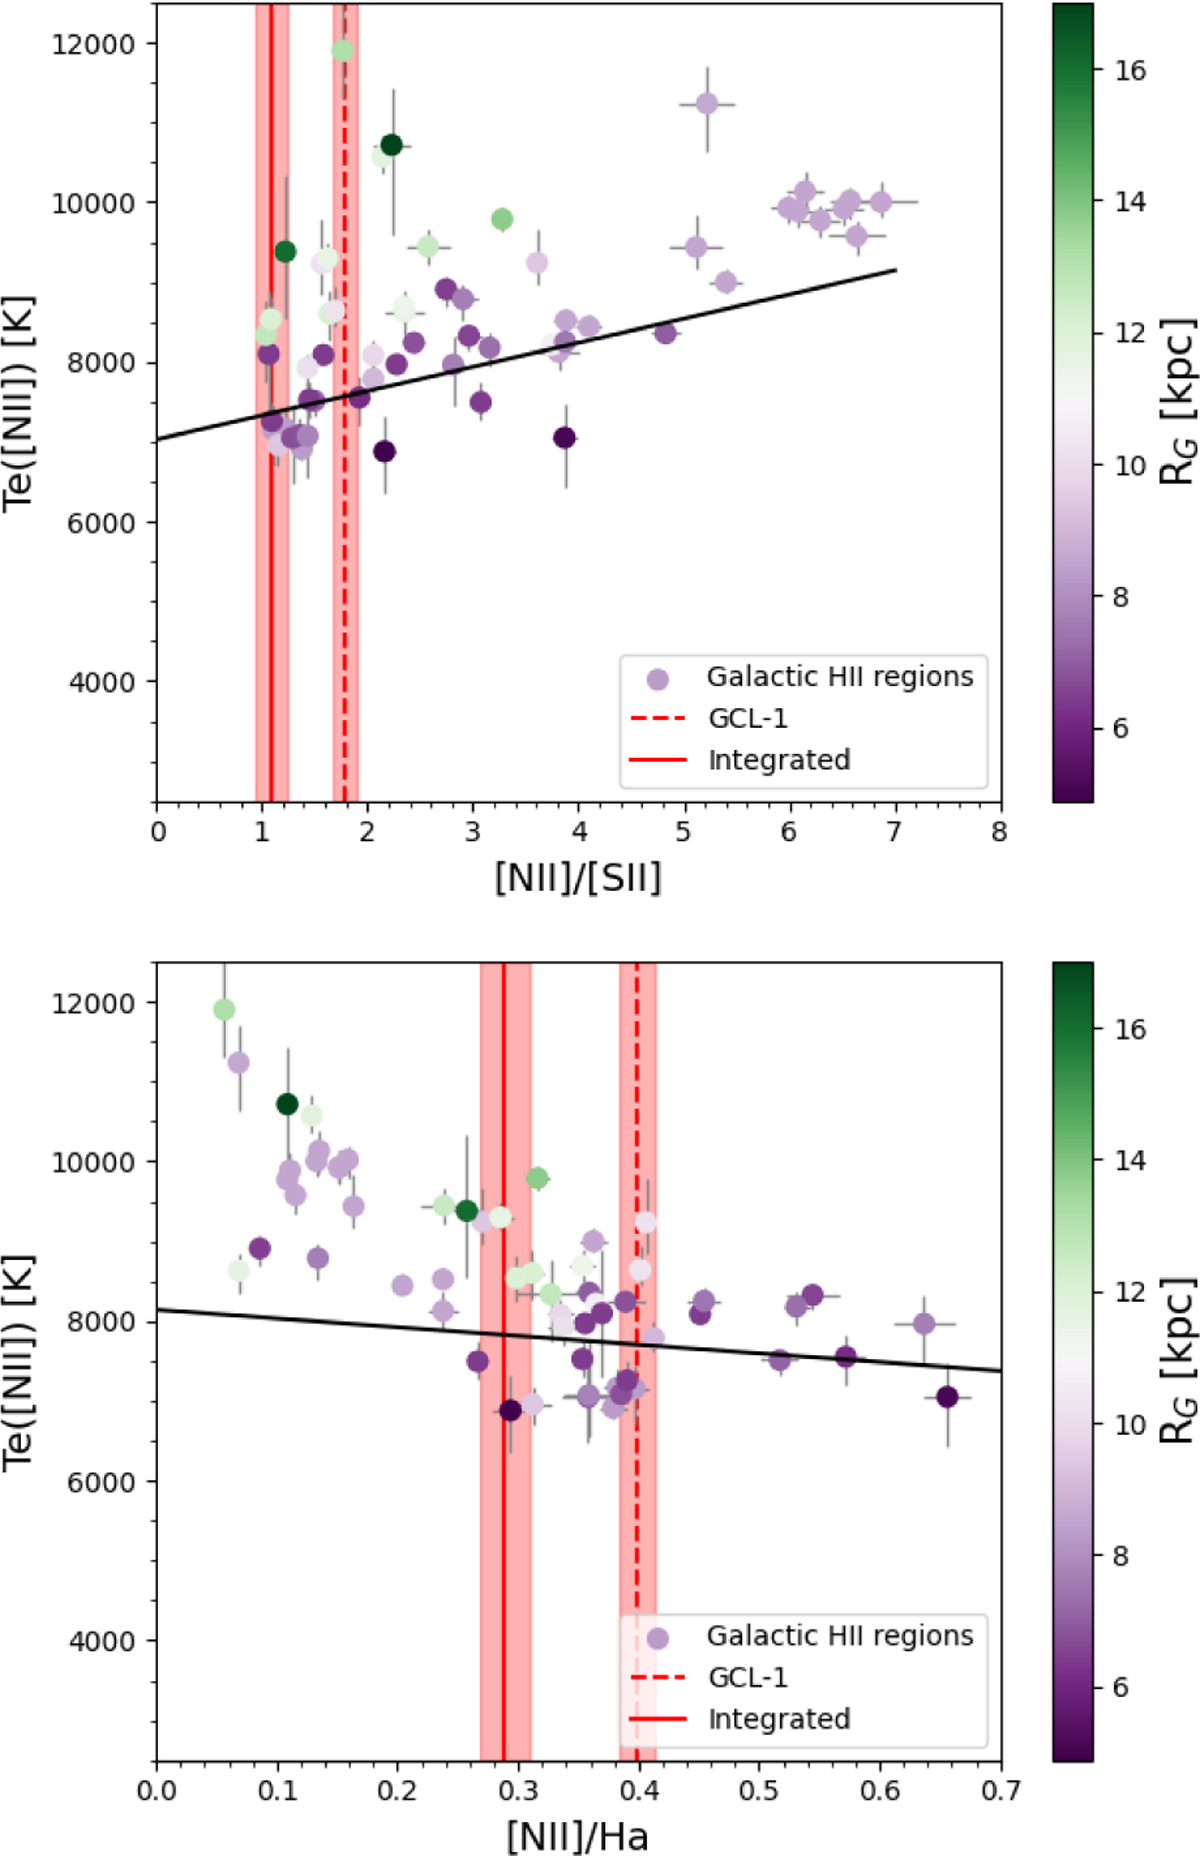
Te [N II] as a function of [N II]/[S II] (top) and [N II]/[S II] (bottom) for a sample of Galactic H II regions (Méndez-Delgado et al. 2023). Points are colored by their Galactocentric radius (RG), and to guide the eye a linear fit (black) is performed for regions within the solar radius (RG < 8.5 kpc). Our Integrated GCL (solid red line) and GCL-1 (dashed red line) measurements are in agreement with the Galactic H II regions, and consistent with a Te ~ 7000–8000 K.
Current usage metrics show cumulative count of Article Views (full-text article views including HTML views, PDF and ePub downloads, according to the available data) and Abstracts Views on Vision4Press platform.
Data correspond to usage on the plateform after 2015. The current usage metrics is available 48-96 hours after online publication and is updated daily on week days.
Initial download of the metrics may take a while.