


Fig. 4
Download original image
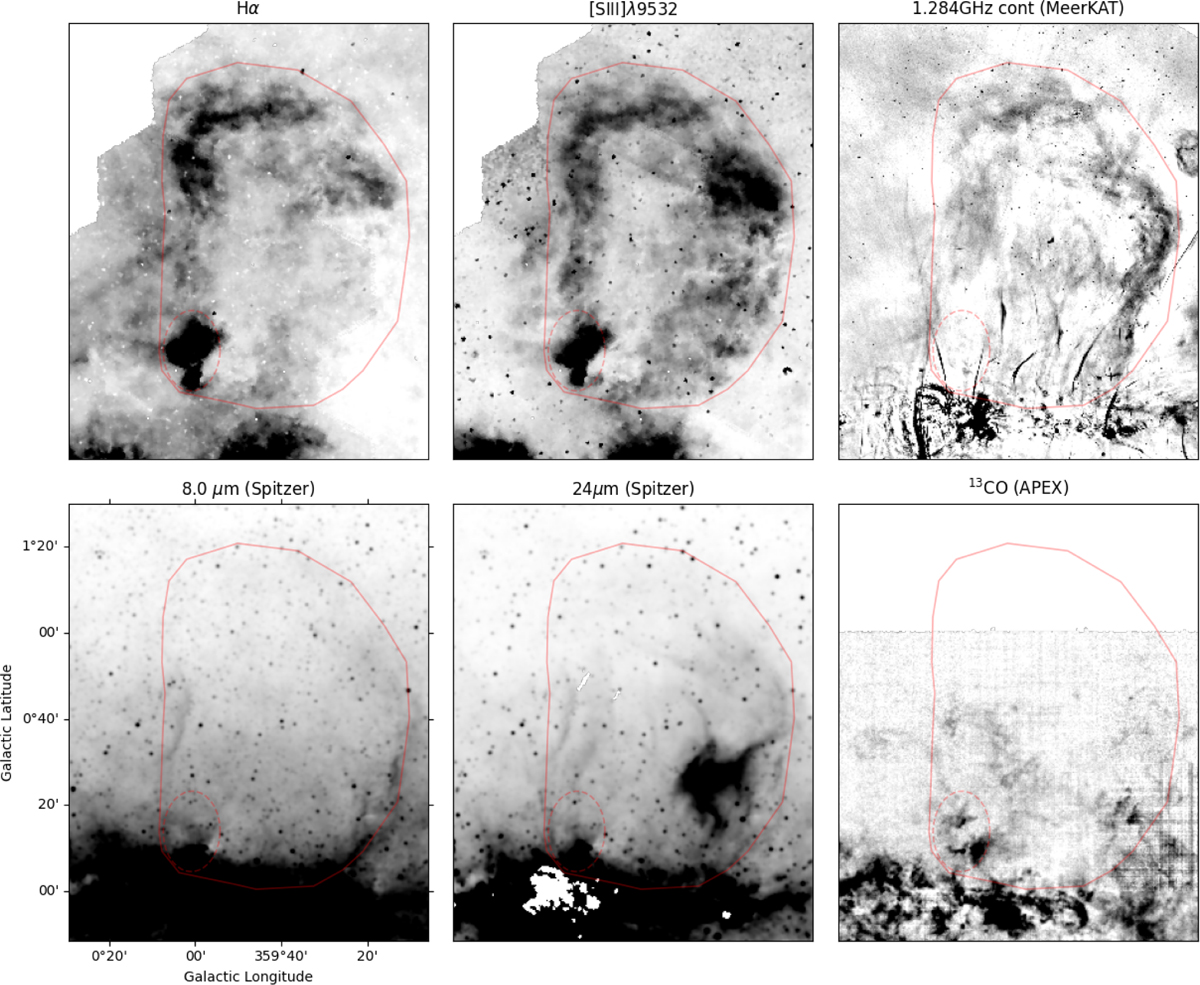
Direct multiwavelength comparison of GCL morphology between LVM optical line emission from Hα and [S III] (top left, center), MeerKAT 1.284 GHz radio continuum (top right), mid-IR dust emission in the PAH dominated 8.0 μm (bottom left) and thermal dust 24 μm (bottom center), and 13CO molecular gas (bottom right). The morphology of the [S III] and radio lobe agrees quite well at high Galactic latitudes, and is encased in an outer shell of PAH emission, with warm dust still in the region interior. CO clouds are offset, outside the GCL boundary. The GCL is marked in a solid red line, and the compact and bright GCL-1 is also marked in a dashed red line.
Current usage metrics show cumulative count of Article Views (full-text article views including HTML views, PDF and ePub downloads, according to the available data) and Abstracts Views on Vision4Press platform.
Data correspond to usage on the plateform after 2015. The current usage metrics is available 48-96 hours after online publication and is updated daily on week days.
Initial download of the metrics may take a while.