


Fig. 5
Download original image
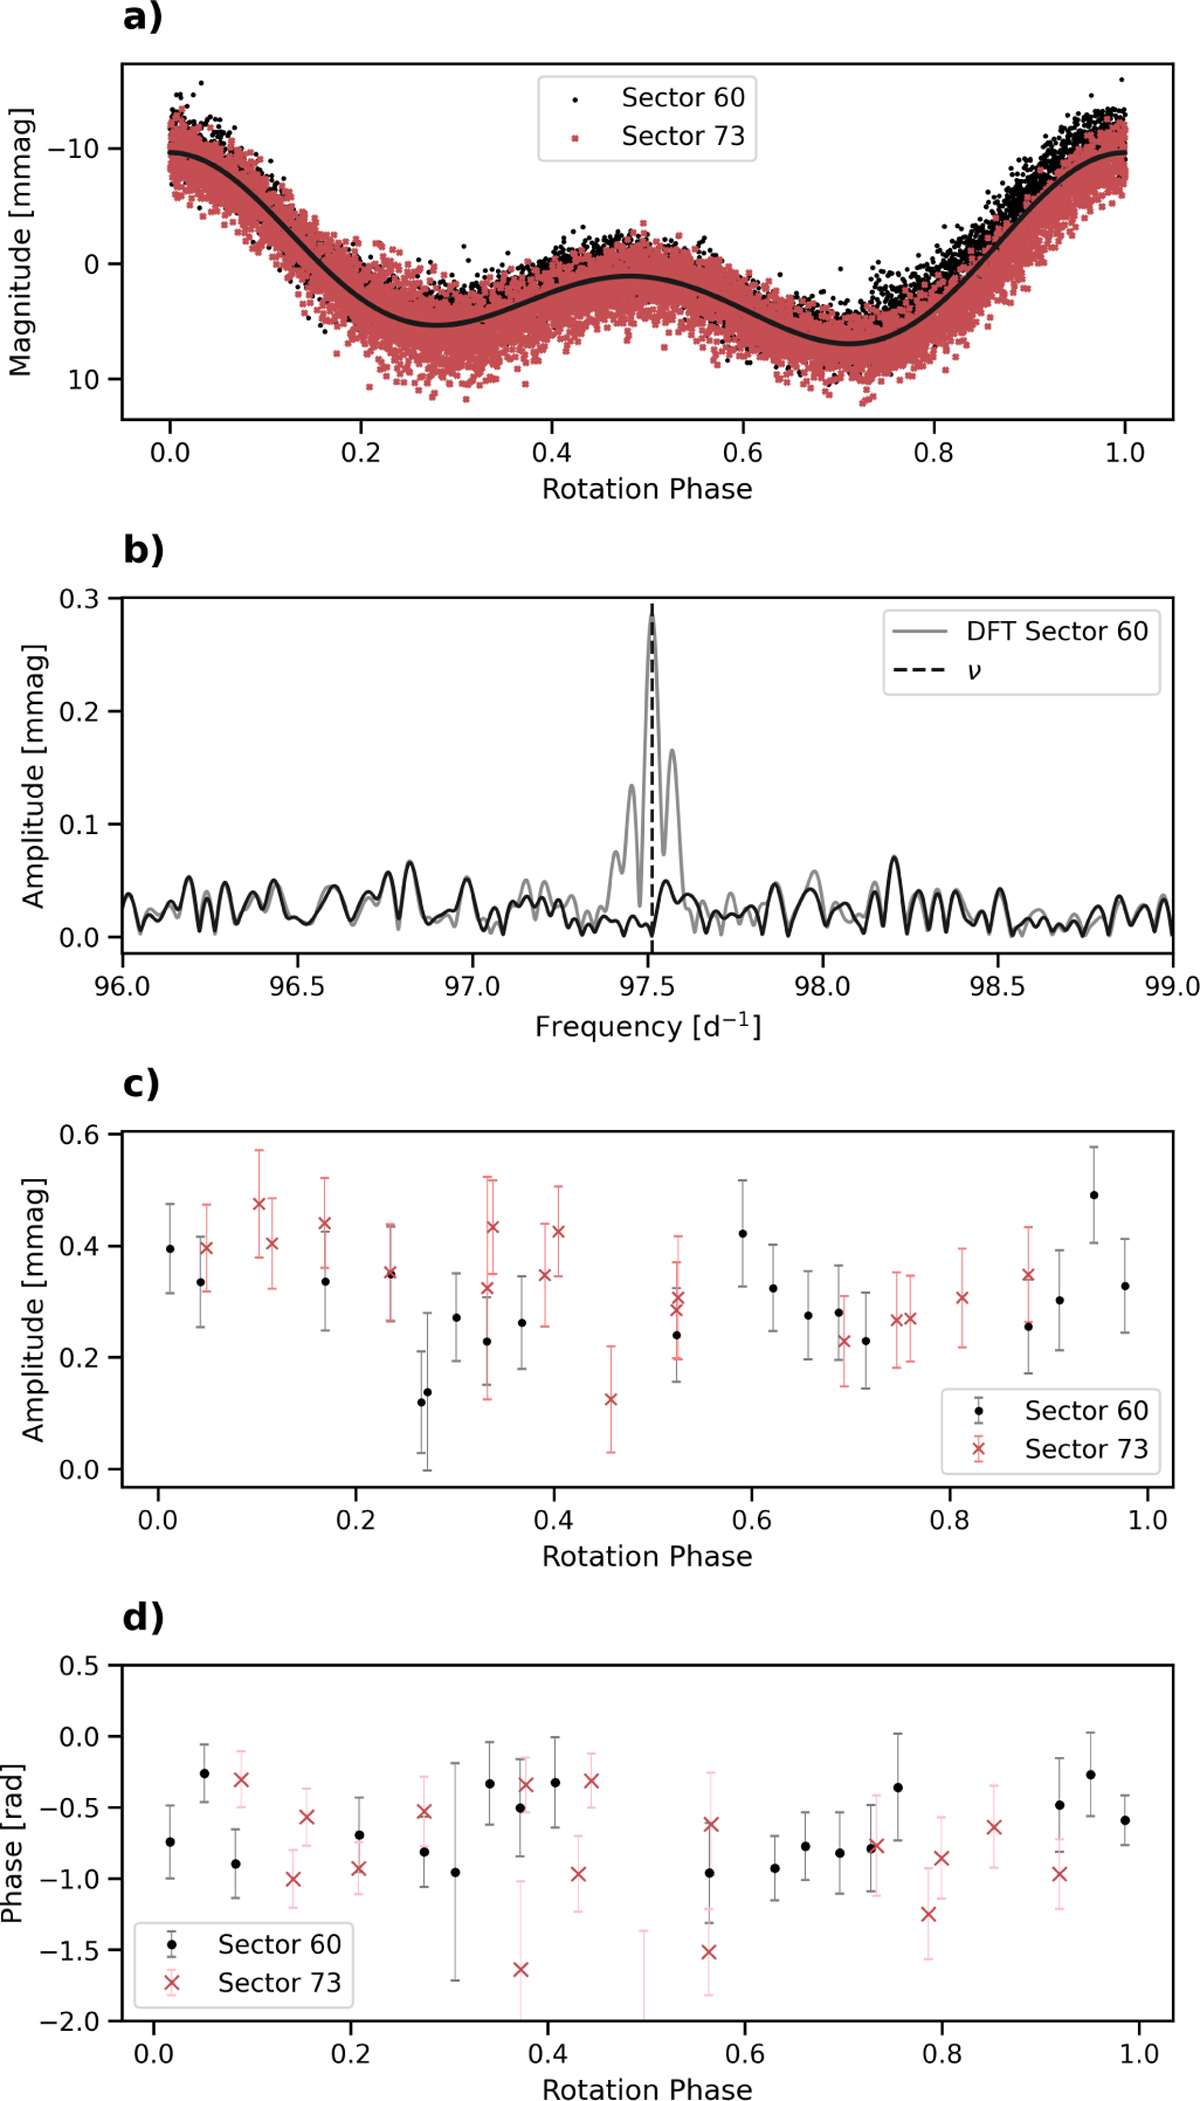
Phase and amplitude variability for the mode frequency ν of TIC252881095, as in Figure 3 (Prot = 2.8917 d). Panel a : phase zero corresponds to rotational light maximum at 59 93 8.4869 (BJD-2 400 000). Panel b shows the DFT of TIC252881095 before (grey) and after (black) subtracting a least-squares sinusoidal fit at the mode frequency from the light curve.
Current usage metrics show cumulative count of Article Views (full-text article views including HTML views, PDF and ePub downloads, according to the available data) and Abstracts Views on Vision4Press platform.
Data correspond to usage on the plateform after 2015. The current usage metrics is available 48-96 hours after online publication and is updated daily on week days.
Initial download of the metrics may take a while.