


Fig. F.1
Download original image
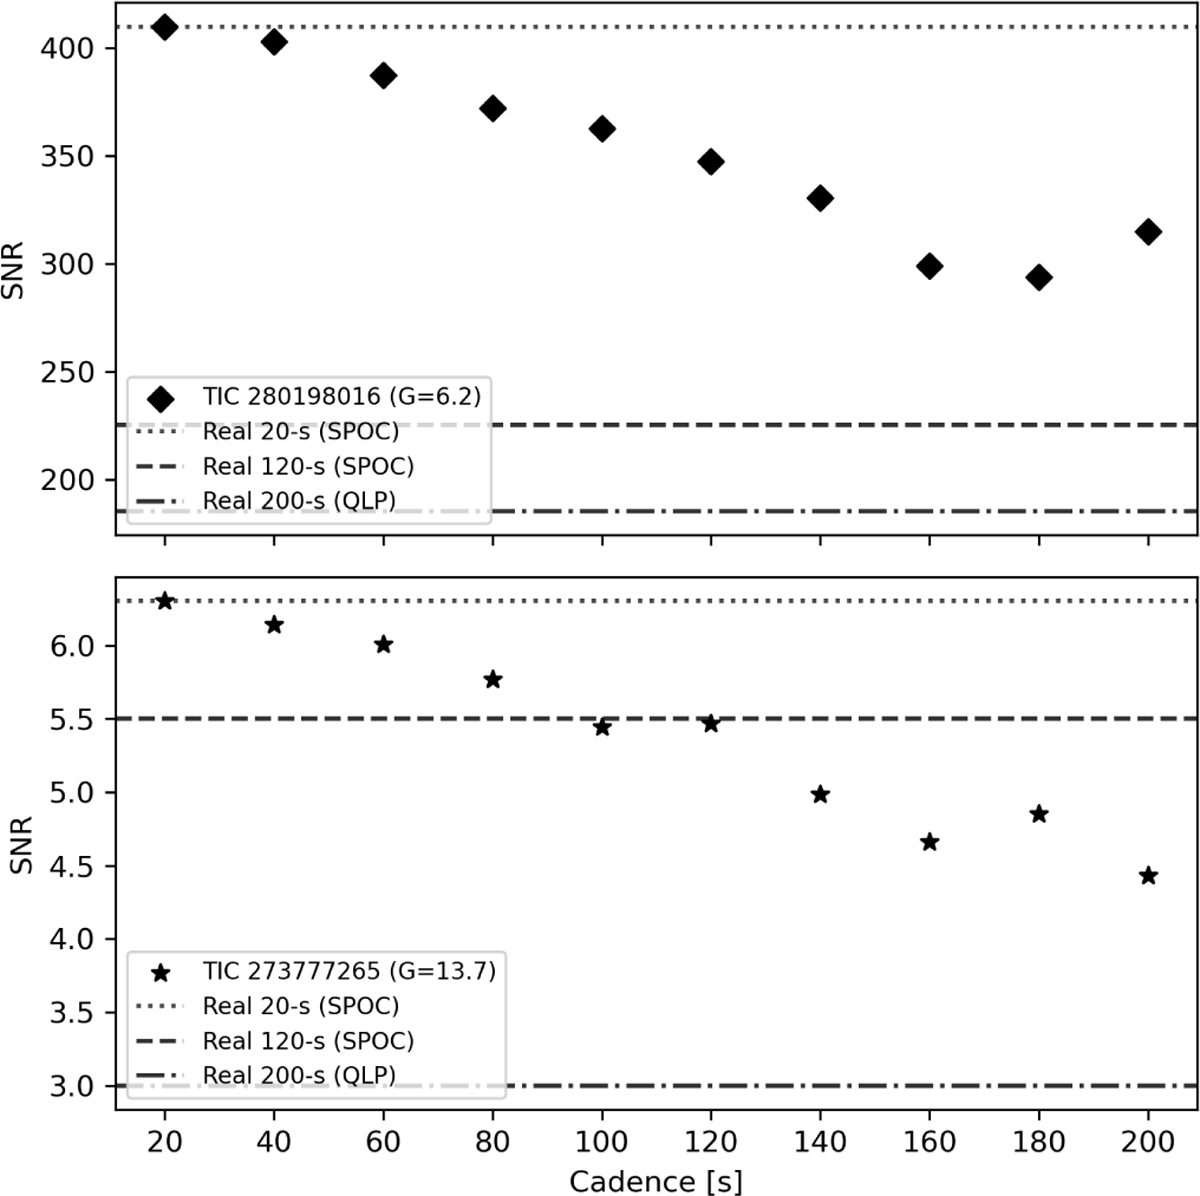
Variation of the S/N of the dominant roAp pulsation as a function of the effective cadence for TIC 280198016 (top panel; Sector 90) and TIC 273777265 (bottom panel; Sector 55). Filled symbols show the S/N measured from the DFT computed from light curves that were artificially degraded from the original 20-s SPOC data to longer cadences. Horizontal lines mark the S/N measured directly from original TESS light curves. The dotted and dashed lines indicate the 20-s and 120-s SPOC products for Sectors 90 (TIC280198016) and 55 (TIC 273777265). The dash-dotted line shows the S/N computed from 200-s QLP light curves Sector 90 (TIC280198016) and Sector 82 (TIC 273777265).
Current usage metrics show cumulative count of Article Views (full-text article views including HTML views, PDF and ePub downloads, according to the available data) and Abstracts Views on Vision4Press platform.
Data correspond to usage on the plateform after 2015. The current usage metrics is available 48-96 hours after online publication and is updated daily on week days.
Initial download of the metrics may take a while.