


Fig. 2
Download original image
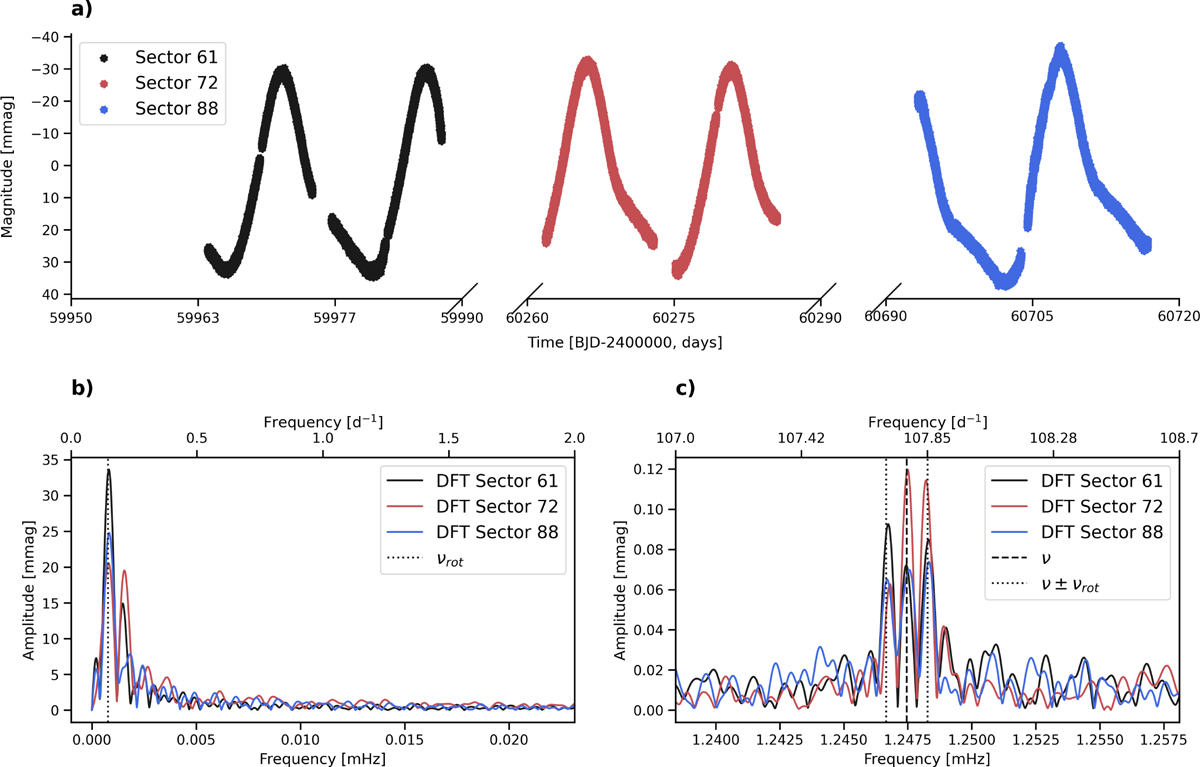
Results of the Fourier analysis performed on QLP data for TIC 312111544. Panel a : QLP light curves from TESS Sectors 61, 72, and 88. Panels b and c show the DFTs of each sector, as well as the mean rotation (b, black dotted line) and the mean mode frequency obtained (c, black dashed line). The black dotted lines in panel c represent sidelobe frequencies. The frequencies highlighted in panel c are obtained after pre-whitening the rotation signals shown in panel b).
Current usage metrics show cumulative count of Article Views (full-text article views including HTML views, PDF and ePub downloads, according to the available data) and Abstracts Views on Vision4Press platform.
Data correspond to usage on the plateform after 2015. The current usage metrics is available 48-96 hours after online publication and is updated daily on week days.
Initial download of the metrics may take a while.