


Fig. A.5
Download original image
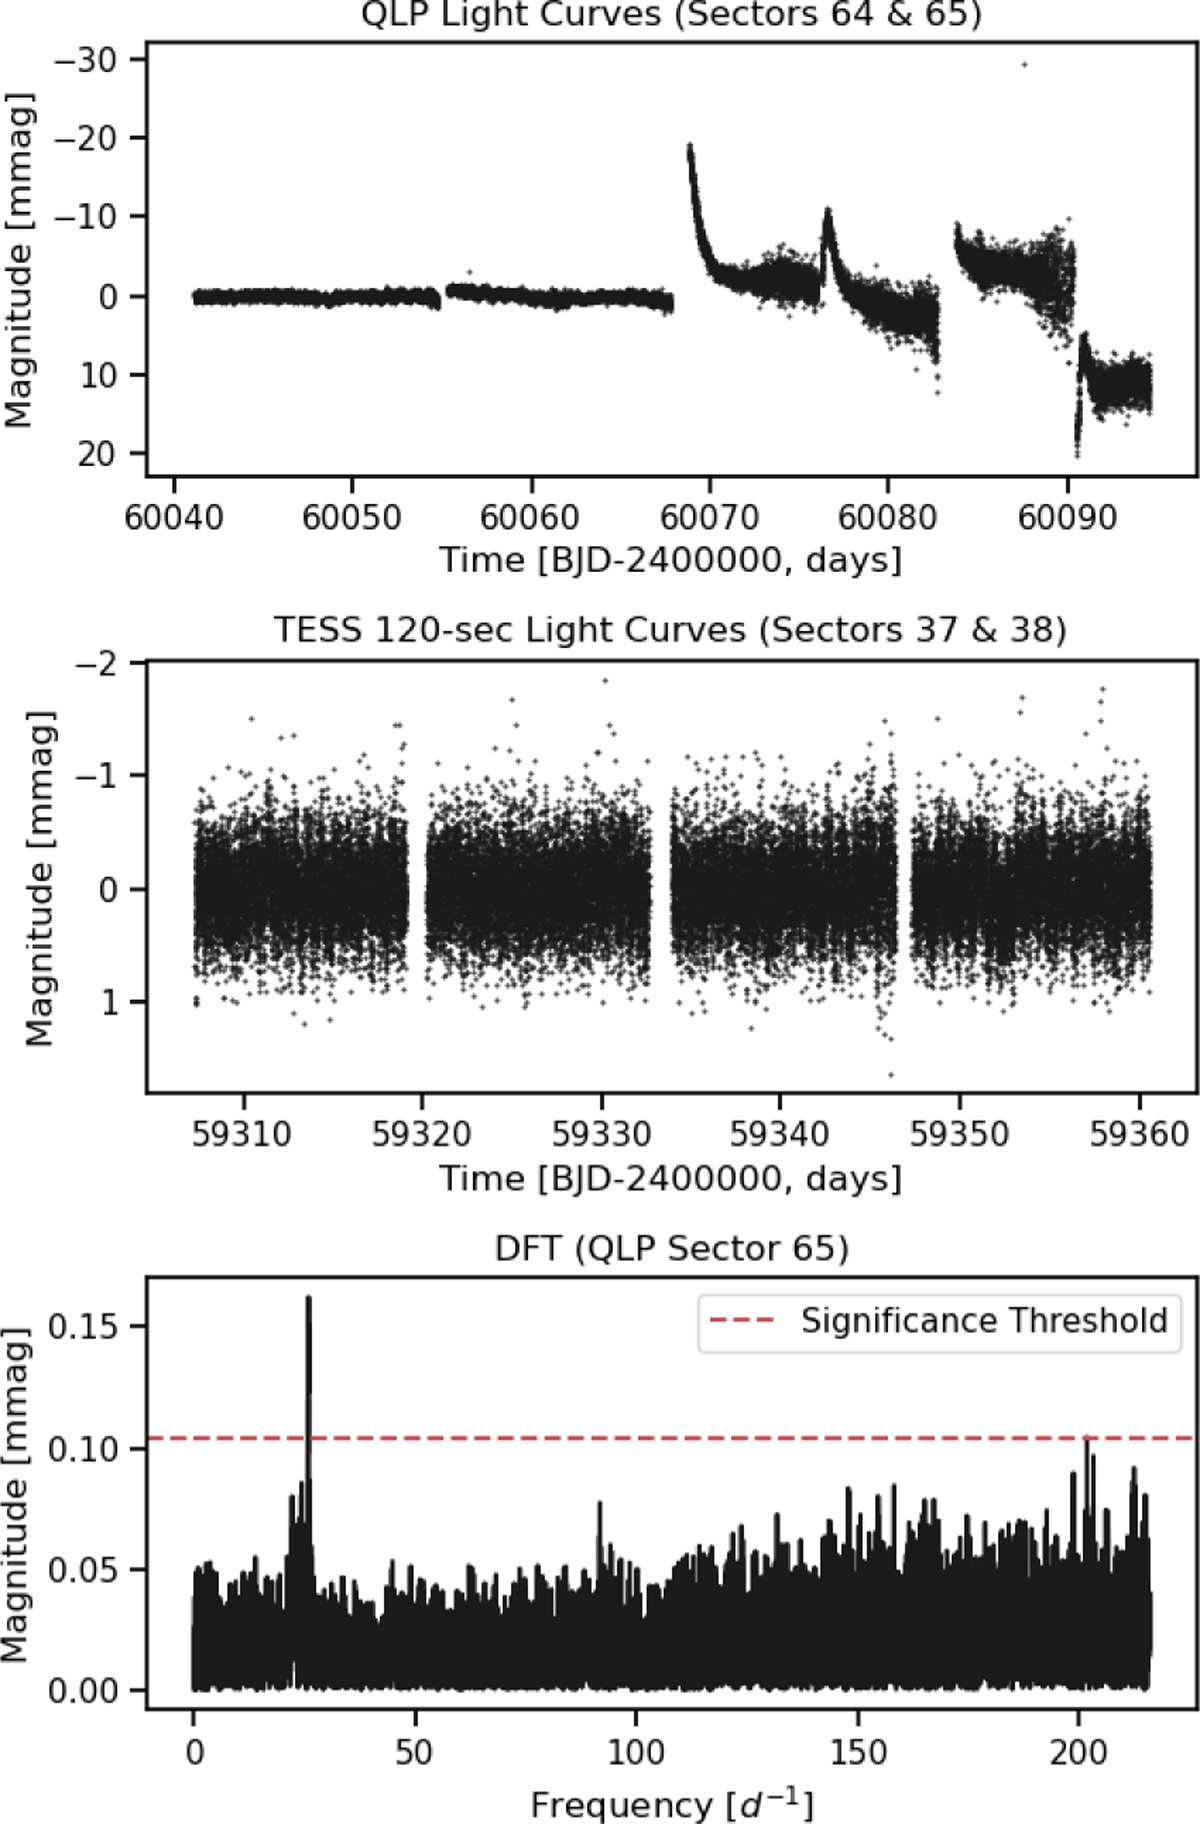
Variability observed for TIC 381942100. Top panel: Raw (SAP) flux from QLP light curves from TESS Sectors 64 and 65 (200-s cadence), showing the difference in variability between the highly variable light curve of Sector 65 compared to the nearly flat light curve of Sector 64. Middle panel: Processed (PDC SAP) flux from SPOC 120s cadence light curves from Sectors 37 and 38. Bottom panel: Discrete Fourier transform (DFT) of the QLP Sector 65 data, where several peaks are visible above the noise level. The dashed red line marks the adopted significance threshold.
Current usage metrics show cumulative count of Article Views (full-text article views including HTML views, PDF and ePub downloads, according to the available data) and Abstracts Views on Vision4Press platform.
Data correspond to usage on the plateform after 2015. The current usage metrics is available 48-96 hours after online publication and is updated daily on week days.
Initial download of the metrics may take a while.