


Fig. 4
Download original image
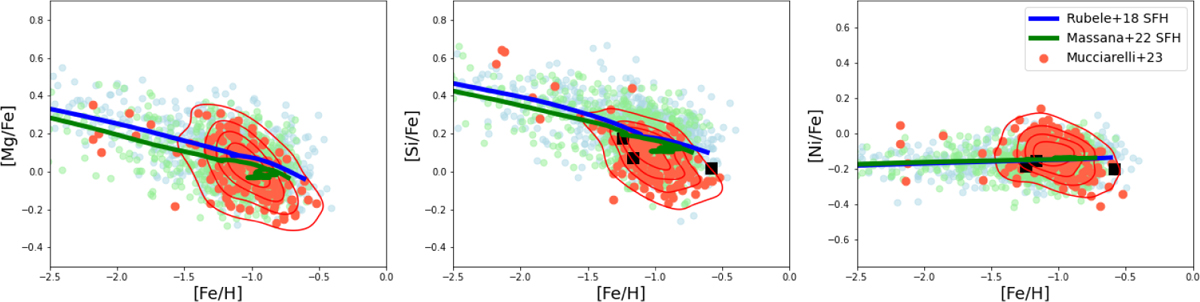
X/Fe] vs [Fe/H] for light elements in the SMC. Abundance patterns are shown for Mg (left panel), Si (central panel) and Ni (right panel) for reference models adopting Rubele et al. (2018) SFH (blue lines and cyan regions) and Massana et al. (2022) SFH (green lines light-green regions). Solid lines are genuine chemical evolution tracks for models with a given SFH, whereas shaded regions are associated model predictions account for observational uncertainties (i.e. synthetic model). Data come from Mucciarelli et al. (2023a, SMC field stars, orange dots) and Mucciarelli et al. (2023b, SMC GCs, black squares). The orange contour lines represent the density lines of the observed stellar distributions in SMC field stars.
Current usage metrics show cumulative count of Article Views (full-text article views including HTML views, PDF and ePub downloads, according to the available data) and Abstracts Views on Vision4Press platform.
Data correspond to usage on the plateform after 2015. The current usage metrics is available 48-96 hours after online publication and is updated daily on week days.
Initial download of the metrics may take a while.