


| Issue |
A&A
Volume 710, June 2026
|
|
|---|---|---|
| Article Number | A18 | |
| Number of page(s) | 23 | |
| Section | Extragalactic astronomy | |
| DOI | https://doi.org/10.1051/0004-6361/202558145 | |
| Published online | 28 May 2026 | |
MARTA: The connection between chemical enrichment, feedback, and dust in a Wolf-Rayet galaxy at z ∼ 2
1
European Southern Observatory, Karl-Schwarzschild Straße 2, D-85748 Garching bei München, Germany
2
Università di Firenze, Dipartimento di Fisica e Astronomia, Via G. Sansone 1, 50019 Sesto Fiorentino, Florence, Italy
3
INAF – Arcetri Astrophysical Observatory, Largo E. Fermi 5, I-50125 Florence, Italy
4
Scuola Normale Superiore, Piazza dei Cavalieri 7, I-56126 Pisa, Italy
5
DARK, Niels Bohr Institute, University of Copenhagen, Jagtvej 155A, DK-2200 Copenhagen, Denmark
6
AURA for European Space Agency, Space Telescope Science Institute, 3700 San Martin Drive, Baltimore, MD 21210, USA
7
Department of Physics, University of Arkansas, 226 Physics Building, 825 West Dickson Street, Fayetteville, AR 72701, USA
8
Centre for Astrophysics Research, Department of Physics, Astronomy and Mathematics, University of Hertfordshire, Hatfield AL10 9AB, UK
9
Institute for Astronomy, University of Edinburgh, Royal Observatory, Edinburgh EH9 3HJ, UK
10
Cavendish Laboratory, University of Cambridge, 19 JJ Thomson Avenue, Cambridge CB3 0HE, UK
11
Kavli Institute for Cosmology, University of Cambridge, Madingley Road, Cambridge CB3 0HA, UK
12
Centro de Astrobiología (CAB), CSIC-INTA, Carretera de Ajalvir km 4 Torrejón de Ardoz, E-28850, Madrid, Spain
★ Corresponding author: This email address is being protected from spambots. You need JavaScript enabled to view it.
Received:
17
November
2025
Accepted:
17
February
2026
Abstract
We present the analysis of the stellar and interstellar medium (ISM) properties of MARTA-4327, a star-forming galaxy at z = 2.223 observed by means of deep JWST/NIRSpec spectroscopy in both medium- and high-resolution gratings as part of the “Measuring Abundances at high Redshift with the Te Approach” (MARTA) program. We report one of the highest-redshift detections of the Wolf–Rayet (WR) blue and red bumps in a non-lensed system. The broad He IIλ4686 feature is consistent with a young (∼5−6 Myr) burst dominated by WN stars, although both stellar population synthesis models and empirical templates struggle to reproduce nitrogen stellar features at ≈4640 Å. Based on the relative strength of the available optical stellar features, we disfavor the presence of very massive stars (VMS) in this system. Elemental abundance ratios such as Ne/O, N/O, and Ar/O align with observations of local star-forming galaxies (including WR galaxies), suggesting that any impact of the WR population on the chemical enrichment of the ISM is strongly localized. However, the gas-phase Fe/O ratio appears enhanced compared to local galaxies of similar metallicity, which we interpret as evidence for reduced Fe depletion onto dust grains, possibly linked to localized destruction in WR-driven wind environments. In addition, we detect a broad (∼445 km s−1) and blueshifted (∼70 km s−1) Hα component, suggesting the presence of an ionized outflow with a mass loading factor η ∼ 0.2. Finally, we report the robust detection of O Iλ8446 emission (among the firsts at high redshift), which we interpret as originating from Lyβ fluorescence and/or collisional excitation in dense clumps. Overall, MARTA-4327 represents a unique system for studying the role of massive stars in shaping the ISM properties of galaxies at Cosmic Noon.
Key words: stars: Wolf-Rayet / galaxies: abundances / galaxies: evolution / galaxies: high-redshift / galaxies: ISM
© The Authors 2026
 Open Access article, published by EDP Sciences, under the terms of the Creative Commons Attribution License (https://creativecommons.org/licenses/by/4.0), which permits unrestricted use, distribution, and reproduction in any medium, provided the original work is properly cited.
This article is published in open access under the Subscribe to Open model. This email address is being protected from spambots. You need JavaScript enabled to view it. to support open access publication.
1. Introduction
Characterizing the physics of galaxies at redshift z ∼ 2 − 3, during the peak of cosmic star-formation, feedback, and black hole activity, has represented one of the most relevant goals for the astronomical community over almost the past three decades. With the advent of 8−10m-class telescopes, paramount efforts have been devoted to perform near-infrared (NIR) spectroscopy from the ground, aimed at observing the optical spectral features required to probe the physical conditions of gas and stars in these systems (e.g., Pettini et al. 2001; Steidel et al. 2003; Erb et al. 2006; Maiolino et al. 2008; Mannucci et al. 2009; Shapley 2011; Steidel et al. 2014; Sanders et al. 2015; Shapley et al. 2015; Strom et al. 2018; Kashino et al. 2019). Because of the large cosmological distance of these sources, however, in most cases the investigation was limited to the brightest emission lines detectable in the spectra, originating from either recombination of hydrogen atoms or collisional excitation of some of the most abundant metal ions (e.g., oxygen, nitrogen, sulfur) present in the gas-phase of the interstellar medium (ISM) of galaxies. Therefore, despite the tremendous advancement in our understanding of galaxy properties at these epochs provided by such extensive programs, several spectral features remained just too faint to be probed by ground-based instrumentation, hiding within the noise of even the deepest observations.
Among such features, auroral lines of metal ions, sensitive to the electron temperature (Te) of the gas and hence key probes of the physics of chemical enrichment in galaxies, have been pursued for a long time. Although a handful of individual low signal-to-noise (S/N) measurements have been reported in the past using ground-based telescopes (e.g., Christensen et al. 2012; Sanders et al. 2016; Patrício et al. 2018), these were not representative of the “typical” galaxy population at z ∼ 2. Information on the metallicity of sources at Cosmic Noon has therefore been inferred by means of indirect tracers constituted by ratios of bright emission lines calibrated on local samples of galaxies (e.g., Pettini & Pagel 2004; Maiolino et al. 2008; Curti et al. 2017), or on samples of analogs of high-z sources (e.g., Bian et al. 2018), despite the potential biases induced by the different physical conditions among which nebular emission occurs in early galaxies compared to the local Universe.
The advent of the James Webb Space Telescope (JWST) rapidly changed the landscape of the field, as several auroral line detections have been reported within the first years of operations (e.g., Curti et al. 2023; Nakajima et al. 2023; Sanders et al. 2024; Laseter et al. 2024), allowing for a more “direct” probe of the metallicity of the gas in high-z sources. Notably, the vast majority of such detections concerned the high ionization [O III]λ4363 auroral line, which was preferentially detected in spectra of z ≳ 5 galaxies as possibly favored by the combination of high ionization parameter and low metallicity, coupled with the higher sensitivity of JWST/NIRSpec beyond 2 μm.
Among JWST projects approved in Cycle 1, the “Measuring Abundances at high Redshift with the Te Approach” (MARTA) Programme (PID 1879) was primarily aimed at delivering high S/N rest-frame optical spectra of individual z ∼ 2 sources by means of very deep integrations in G140M/F100LP and G235M/F170LP grating/filter configurations, allowing a detailed characterization of the physical conditions of the ISM in z ∼ 2 galaxies leveraging the detection of both bright and faint emission lines (Cataldi et al. 2025). Thanks to this and other dedicated observational efforts such as the CECILIA (Strom et al. 2023), AURORA (Shapley et al. 2025), and EXCELS (Carnall et al. 2024) surveys, the number of auroral line measurements (including low-ionization ionic species) at z ∼ 2 − 5 is rapidly increasing, allowing not only to directly test the behavior of strong-line metallicity diagnostics over this largely unexplored redshift range (e.g., Chakraborty et al. 2025; Scholte et al. 2025; Cataldi et al. 2025; Sanders et al. 2025), but also to get insights into the star-formation history of galaxies from detailed studies of multiple elemental abundance patterns (e.g., Rogers et al. 2024; Bhattacharya et al. 2025; Arellano-Córdova et al. 2025; Stanton et al. 2025), shedding light on the role of massive stars in driving early chemical enrichment.
In this context, galaxies hosting Wolf–Rayet (WR) stars offer a rare opportunity to study the impact of massive stellar populations on the ISM. At low redshift, WR galaxies exhibit localized chemical enrichment (e.g., López-Sánchez & Esteban 2010), shock-excited gas (e.g., Brinchmann et al. 2008b), and enhanced Fe emission lines (Izotov et al. 2018; Kojima et al. 2021), suggesting active metal injection and dust processing. However, little is known about their counterparts at z ∼ 2, when star formation and feedback processes were most intense, as WR features tend to be elusive (also in light of the short lifetimes of these stars) and have only been detected at high-z in strongly lensed systems such as the “Sunburst Arc” (Rivera-Thorsen et al. 2024). The impact of WR populations on high-z galaxy properties has also been invoked by means of indirect evidence, for example, on specific line ratios and chemical abundance patterns such as enhanced N/O (e.g., Curti et al. 2025; Gunawardhana et al. 2025).
In this paper, we present the analysis of a z = 2.224 galaxy from the MARTA program, namely MARTA-4327 (M4327 hereafter), where we report the highest-redshift detections of the WR “blue” and “red” bump spectral features in a non-lensed galaxy. We present a detailed study of the chemical enrichment and dust properties of the system, leveraging also a direct determination of the gas-phase iron (Fe) abundance. We outline observations and data processing in Sect. 2, and the spectral fitting procedure in Sect. 3. Sect. 4 details the methods employed to derive the physical quantities of interests, while we interpret our findings and discuss their physical implications in Sect. 5. Finally, we summarize our results in Sect. 6. Throughout this work, we assume a Planck Collaboration (2020) cosmology, with H0 = 67.4 km s−1 Mpc−1, ΩM = 0.315, and ΩΛ = 0.685. Solar abundances are taken from Asplund et al. (2021).
2. Observations and data processing
The requirement for deepest integration in MARTA (32 hours in G140M/F100LP) was driven by the goal of reaching a line sensitivity of ∼10−19 erg s−1 cm−2, aimed at detecting [O III]λ4363 in the high-priority targets of our sample. An additional seven hours of integration were performed in G235M/F170LP to cover the rest-frame optical wavelength range up to ∼1 μm, which includes not only strong nebular lines such as Hα, [N II], and [S II], but also the [O IIλλ7320,7330 doublet for all targets at z ≲ 3. Finally, three hours of integration with the G235H/F170LP configuration were spent, aimed at performing a better kinematical decomposition and search for faint and broad components under the Hα line. MARTA targeted in total 127 galaxies with one NIRSpec pointing in the COSMOS field. Details of sample selection and MSA design prioritization are given in Cataldi et al. (2025).
For the analysis presented in this paper, we have taken advantage of the most recent realization of the data reduction pipeline provided by the NIRSpec GTO team (described in Scholtz et al. 2025), which extends the extracted and calibrated spectral traces on the detector significantly beyond the nominal red-end boundary for each grating/filter configuration. This enabled us to recover more emission lines compared to the standard data reduction pipeline, as, for example, the G235M/F170LP spectrum now extends up to ∼4 μm. To assess consistency in the flux calibration, we compared the spectra of the two medium resolution gratings in their overlapping region, where the median flux densities are found to be in agreement within 1%. Furthermore, we checked for any residual, relative flux calibration issue as a function of wavelength (possibly due to non-adequate pathlosses correction, which are modeled by default assuming point-like source geometry) by comparing the synthetic photometry extracted from the spectrum with the in-slit photometry derived from available NIRCam images in F115W, F150W, F200W, F270W (i.e., the broadband filters overlapping with our NIRSpec filter choice), finding good agreement and the need for only minor correction. The complete procedure is described in Appendix A. Finally, we note that, in order to maximize the number of observable sources within one pointing, in MARTA we allowed moderate overlapping of spectral traces onto the detector, as the filling factor of emission lines on the detector is very low (hence, it is the probability of emission lines overlap from two different sources). However, given the depth of our observations, in many cases significant continuum emission is detected, potentially contaminating the upper and/or lower shutters of a given slitlet and preventing the adoption of the standard “nodded” background subtraction. In the specific case of M4327, however, no strong contamination from other sources is present, and the source does not extend significantly beyond the central shutter of the MSA slitlet in any of the NIRCam filters; therefore, a standard nodding approach for background subtraction has been adopted.
The top panel of Figure 2 reports the reduced, calibrated, and extracted 1D spectrum of M4327, with the spectra of G140M/F100LP (green) and G235M/F170LP (red) gratings plotted beside each other. The emission lines detected in the spectrum are also marked.
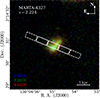 |
Fig. 1. False color RGB image of M4327. The three-shutters long NIRSpec slitlet and the effective five-shutters locations spanned by the three-nodding pattern are overlaid. |
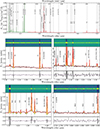 |
Fig. 2. JWST/NIRSpec spectrum of MARTA-4327. Top panel: Combined G140M/F100LP (green) and G235M/F170LP (red) spectrum. The main emission lines detected are reported. Middle panels: Zoom-in onto the region of the auroral lines, i.e., [O III]λ4363 and [S II]λ4069 in G140M (left), [S III]λ6312 and [O IIλλ7320,7330 in G235M (right). The PPXF best-fit to the spectrum is overlaid in red (continuum in green, emission lines highlighted in yellow), while the 2D spectra and the fit residuals are shown in the upper and lower inset panels, respectively. Bottom panels: Zoom-in onto the region of high-order Balmer lines (left), and Paschen and O I λ8446 lines (right). |
3. Spectral analysis
3.1. Full spectral fitting
We summarize here the spectral fitting steps implemented for M4327, while more details on the full fitting procedure for MARTA galaxies are given in Cataldi et al. (2025).
The full spectral fitting of the extracted 1D spectrum has been performed using the PYTHON implementation of the PPXF software (Cappellari & Emsellem 2004; Cappellari 2017, 2023), which enables simultaneous modeling of both emission lines and the stellar continuum. The fitting was carried out separately over the full wavelength ranges of the G140M and G235M gratings.
To model the stellar continuum, we employed the Binary Population and Spectral Synthesis (BPASS) templates v2.2.1 (Stanway & Eldridge 2018) with a Chabrier (2003) initial mass function and an upper-mass cut-off of 300 M⊙. We convolved the continuum templates with a wavelength-dependent Gaussian kernel based on the instrumental line spread function (LSF) curves for each grating, as retrieved from the JWST documentation1. To account for the effect of residual flux calibration issues and template mismatch, we applied a 10-degree multiplicative polynomial to the continuum model. Emission lines were included as gas templates, modeled by individual Gaussian profiles, and fitted simultaneously with the stellar continuum. This approach is critical, especially in spectral regions where stellar absorption features overlap with line emission. We verified that the inferred fluxes of the faintest lines of interest for this work (e.g., the [O III]λ4363 auroral line) remained stable within 2% among different choices of degrees of multiplicative polynomial, ensuring that the continuum adjustments did not introduce significant biases. The results of our fitting procedure are shown in the middle and bottom panels of Fig. 2: the observed spectrum is shown in black, while the full PPXF best-fit spectrum is overlaid in red (with the best-fit stellar component in green and the area underlying detected emission lines is shaded in gold). Beside classical bright emission lines such as [O II]λ3727,29, [O III]λ5007, Hβ, Hα, [N II]λ6548,84, and [S II]λ6717,32, we report the detection of auroral lines of both oxygen ([O III]λ4363, [O IIλλ7320,7330) and sulfur ([S II]λ4069, [S III]λ6312) ions, together with other semi-faint forbidden lines such as, for example, [Ar III]λ7135 and [S III]λ9058, the OIλ8446 permitted line, hydrogen recombination lines down to H12, five lines from the Paschen series (Paγ, Paδ, Pa10, Pa11, Pa12, the former two recovered thanks to the new data reduction2, see Sect. 2), and several helium recombination lines (including He Iλ1.032 μm). Specifically, the middle panels of Fig. 2 focus on the spectral region surrounding auroral lines, while the bottom panels zoom-in onto the regions of [O II]λ3727 and high-order Balmer lines (left), He Iλ1.032 μm and Paschen lines (right), respectively.
3.2. Detection of blue and red optical bumps
Figure 3 shows a zoom-in of the G140M and G235M spectra around the λ ∈ [4575, 4750] and [5650,5950] wavelength regions, showing evidence for the presence of the so-called blue and red bump features associated with WR stars. More specifically, in the left-hand panel a broad feature, likely from stellar He IIλ4686 emission, is observed, together with flux excess between ≈4613 Å and ≈4650 Å, tracing a complex of stellar features including metal lines from N V, N II, N III, and C III. The narrow line at 4658 Å is instead nebular in origin and traces Fe III in emission. A fit to the continuum and the narrow [Fe III]λ4658 emission line is overlaid (solid red line), while a single-Gaussian fit to the broad He IIλ4686 emission is shown as the dashed red line, giving a full width at half maximum (FWHM) = 1460 ± 170 km s−1. By integrating over the shaded blue regions (while excluding at the same time nebular emission), we derive a rest-frame equivalent width (EW) for the [N III+C III] complex (4605 − 4650 Å) of EW0(N–C) = 2.5 ± 0.5 Å, and for the He II emission of EW0(He II) = 4.2 ± 1 Å.
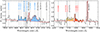 |
Fig. 3. Blue and red bump features in M4327. The plots show a zoom-in on the spectral region between 4550−4750 Å (left panel), and 5650−5950 Å (right panel), highlighting both stellar and nebular features. Features associated with the so-called blue and red bumps are marked in blue and red, respectively, with nebular line emission in black. The shaded regions highlight the spectral ranges adopted to derive the EW of the associated stellar features (as reported in Table 1), with the “extended red bump” region defined by the combined orange and red area. A single Gaussian fit to the broad He IIλ4686 emission is shown by the dashed line, while the fit to the nebular [Fe III]λ4658 and HeIλ5875 emission lines are marked by solid lines (and shaded in gray). |
Physical properties of MARTA-4327.
The red bump instead is primarily a blend of C IV transitions at λ5801,5812, and appears much less prominent in the spectrum of M4327, as shown in the right-hand panel of Figure 3. However, an excess emission over the continuum level between ≈5740 − 5850 Å is detected. Integrating the spectrum over the entire shaded region (5730 − 5850 Å, orange plus red in Fig. 3) produces EW[red bump] = 12 ± 4 Å, whereas integrating only over the red region around the expected C IV emission (5780 − 5850 Å) delivers EW = 6 ± 3 Å. Based on extensive discussion about their origin in the literature (see, e.g., Crowther 2007, and references therein for a review on the topic), we suggest that these features could originate from a population of WR stars of the nitrogen type (WN), in that the (N III + C III) complex has a strength comparable to the He II bump, while the red bump is only marginally detected. A more quantitative analysis and discussion are presented in Sect. 5.1.
3.3. Detection of O Iλ8446
In addition to classical nebular lines, we report the presence of the permitted emission line O Iλ8446, detected at ∼8σ significance (see bottom-right panel of Fig. 2). This detection represents one of the first of its kind in individual star-forming galaxies at high redshift, having been reported to date only in stacked spectra (Strom et al. 2023) or in highly magnified systems such as the ‘Godzilla’ stellar complex in the Sunburst Arc (Choe et al. 2025), while it is generally more commonly observed in local active galactic nuclei (AGNs; e.g., Rudy et al. 1989; Rodríguez-Ardila et al. 2004; Matsuoka et al. 2007). As such an emission line is rarely observed, its origin in the context of high-z galaxies such as M4327 warrants closer examination: we discuss possible physical mechanisms powering this line in Sect. 5.4.
3.4. Signatures of broad components in the high-resolution grating
We also performed emission-line fitting on the G235H/F170LP spectrum. The higher spectral resolution of such a grating allows us to search for the presence of fainter, broad components under Hα (associated with different kinematic components, e.g., tracing outflowing gas). In this case, given the shallower exposure time (three hours on-source) and higher spectral resolution, no detailed stellar continuum features are observed, and we model the continuum with a simple power-law. The emission lines are still modeled by individual Gaussian components (convolved with the G235H LSF curve), with the exception of Hα, for which an additional broad component is included.
The results of the G235H/F170LP fitting are shown in Figure 4. We detect, with high significance (based on the BIC criterion, with ΔBIC ≫ 10, Schwarz 1978), a broad component under Hα, blueshifted by 71 km s−1 with respect to the systemic redshift and with FWHM = 445 km s−1. We discuss a possible interpretation of such a component as tracing outflowing gas in Sect. 5.3, whereas an alternative, more speculative scenario involving the presence of an active black hole is discussed in Appendix D.
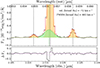 |
Fig. 4. Zoom-in on the Hα and [N II]λ6585 emission lines in the G235H/F170LP grating. The best-fit model is overlaid in red, with the Hα broad component highlighted in green. The inclusion of such a component significantly improves the fit, with a ΔBIC ≫ 10 compared to the one-component fit. The Hα broad component (FWHM = 445 km s−1) is blueshifted from the systemic redshift by ∼70 km s−1, possibly tracing outflowing gas in the galaxy. |
4. Derivation of physical properties
4.1. Nebular attenuation
We begin by studying the dust attenuation properties of M4327, leveraging the detection of multiple hydrogen recombination lines, including the Balmer lines, down to H12 and Paschen lines Pa12, Pa11, Pa10, Paδ, and Paγ. In Fig. 5 we report the quantity R, defined as the logarithm of the ratio between the observed and theoretical ratio of a given hydrogen line to Hα, R = log10(Robs/Rtheo) (where Rtheo is computed for a fiducial Case B recombination, Te = 1.2 × 10⁴ K, ne = 100 cm−3), as a function of wavelength. The colored lines represent the R vs λ relationship predicted for different values of E(B − V), given the Cardelli et al. (1989) (solid lines) and Gordon et al. (2003) (dashed lines) extinction curves for the Milky Way (MW, RV = 3.1) and Small Magellanic Cloud (SMC, RV = 2.74), respectively. The solid black curve reports the R vs λ relationship for the best-fit value E(B − V) obtained by performing a least-square fit to all available hydrogen line ratios (assuming the law Cardelli et al. 1989), and corresponds to E(B − V) = 0.16 ± 0.01 (AV = 0.50 ± 0.03). The black curve matches the Balmer lines of the highest S/N, whereas the high-order Balmer lines H10, H11, H12, as well as Paschen lines, deviate from the best-fit predictions. For what concerns high-order Balmer lines (H10, H11, H12), we note that their measured flux is strongly sensitive to the shape of the stellar continuum in that region and, in particular, to the depth of the underlying stellar absorption features, which introduces model-dependent systematics. Furthermore, possible deviations from the Case B recombination for high-order Balmer lines have been discussed, for example, in Mesa-Delgado et al. (2009).
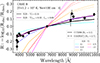 |
Fig. 5. R versus wavelength for M4327. The logarithm of the ratio between observed and theoretical (Case B) line ratios of hydrogen lines to Hα, R, is plotted as a function of wavelength. Colored lines represent the R vs λ relationship predicted for different values of E(B − V), given the Cardelli et al. (1989) (solid lines, RV = 3.1) and Gordon et al. (2003) Small Magellanic Cloud (dashed lines, RV = 2.74) attenuation curves, respectively. The black curve reports the relationship obtained by performing a least-square fit to all available hydrogen lines ratios (for a Cardelli et al. 1989 law), whereas the purple curve represents the best-fit E(B − V)cov and fcov values obtained by adopting the dust-covering fraction model by Reddy et al. (2025). |
Interestingly, discrepancies between the Balmer and Paschen lines might reveal clues to the properties and geometric distribution of dust. Recently, Reddy et al. (2025) analyzed a large sample of z ∼ 2 − 3 galaxies from the AURORA survey, finding evidence for an offset between E(B − V) values inferred from Balmer and Paschen lines, when these two subsets of lines are fitted separately. A possible turnaround invokes the assumption of a dust-covering fraction lower than one (fcov < 1), such that part of the light escapes from the nebula unattenuated. This practically translates into a wavelength-dependent, light-weighted reddening, i.e., the E(B − V) depends on which lines are adopted in its derivation. In this scenario, the E(B − V) computed from the Balmer lines at bluer wavelengths is lower than that derived from the Paschen lines, as emission lines at shorter wavelengths are weighted more heavily toward the un-reddened sightlines, and vice versa.
We therefore performed a fit to our set of Balmer and Paschen lines adopting the Reddy et al. (2025) formalism (and the Cardelli et al. 1989 law): this is marked by the purple solid line in Fig. 5 and delivers a best-fit E(B − V)cov = 0.52 ± 0.20 and fcov = 0.69 ± 0.06. We observe that such a framework provides a much better simultaneous match to both Paschen and the brightest Balmer lines (Hα, Hβ, Hγ, Hδ, Hϵ) (while still struggling to reproduce all high-order Balmer lines). Therefore, throughout the rest of the analysis we model the nebular attenuation as produced by a dust geometry with variable fcov (i.e., the effective E(B − V) does depend on wavelength), as we note that the impact of a variable fcov on the inferred physical properties of galaxies (especially those sensitive to ratios of emission lines widely spaced in wavelength, such as the temperature Te[O II] of the O+ ion, see Sect. 4.2) can be significant. We defer a more thorough analysis of the comparison between different assumptions on the dust properties, shape of the attenuation curve, and their impact on the derivation of ISM properties in high-z galaxies to forthcoming work.
4.2. Simultaneous modeling of temperature, density, and AV
We simultaneously infer Te, ne, and AV by forward-modeling multiple emission line ratios and comparing them with the observed values within a Bayesian framework. Because theoretical Case B values for different hydrogen line ratios depend (mildly) on temperature and density, this would affect the derivation of AV and, as a consequence, the temperatures and density themselves as derived from reddening-corrected emission line ratios. Following what was discussed in Sect. 4.1, we model the nebular attenuation following the formalism by Reddy et al. (2025) and include the dust-covering fraction of dust fcov as an additional free parameter.
We defined the likelihood as L = exp( − χ2/2), with χ2 equal to
 (1)
(1)
and where σλ1, 2 is the uncertainty on the flux ratio between the emission lines at λ1 and λ2. The predicted flux ratios are modeled as
 (2)
(2)
where E is the emissivity (which is a function of density and temperature), k(λ) is the reddening law, AV is the extinction in magnitudes in the V band and fcov the dust-covering fraction. The χ2 includes co-adding multiple terms that comprise ratios between hydrogen lines from both Balmer and Paschen series, auroral-to-nebular line ratios of the same ion (hence, that do not depend on relative abundances), which are strongly sensitive to Te (with a milder, secondary dependence on ne), and density-sensitive line ratios.
For hydrogen, all line ratios are computed with respect to Hα, and the ratios between relative emissivities are modeled under the assumption of Case B recombination. The following hydrogen emission lines are included in the model: Hα, Hβ, Hγ, Hδ, H73, H9, H10, H11, and H12 from the Balmer series (we exclude the H8+HeIλ3889 blended complex at this stage, but see Section 4.3.2), as well as Paγ at λ 1.0941 μm, Paδ at λ 1.0052 μm, Pa10 at λ 9017 Å, Pa11 at λ 8865 Å, and Pa12 at λ 8752 Å. For what concerns temperature-sensitive diagnostics, we included the [O III]λ4363/[O III]λ5007 and [O II]λ73254/[O II]λ3727,29 auroral-to-nebular line ratios: in our model, we assume these ratios trace the temperature of two different emitting zones, such that in Equation (2) λ1 and λ2 are λ7325 and λ7328 for Te = T2, and λ4363 and λ5007 for Te = T3, respectively. Finally, we include a term to model the ratio among the lines of the [S II]6718,6732 doublet, strongly sensitive to the gas density ne (and for which we adopt Te = T2 to compute the emissivity, as we assume that S+ traces the same region of the O+ ion responsible for the [O II] transitions).
The free parameters in our model are therefore ne, T2, T3, AV, and fcov, and we run a Markov chain Monte Carlo (MCMC) to explore the parameter space via the EMCEE implementation (Foreman-Mackey et al. 2013), with 24 walkers, 1500 steps, and 20% burn-in. At each MCMC step, the temperature assumed to model the emissivities of hydrogen lines is taken as the average between T2 and T3, and we adopt the Cardelli et al. (1989) attenuation law with RV = 3.1 for dust reddening. The following uniform priors are imposed on the parameters: 0.5 ≤ log10(ne/cm−3)≤4; 0 ≤ AV ≤ 5; 0 ≤ fcov ≤ 1; 0.5 ≤ T2, 3/104 K ≤ 2.5.
We obtain Te[O II] = 12260 K, Te [O III] = 11430
 K,
K,  cm−3,
cm−3,  , and
, and  . The corner plots of the MCMC run and the comparison between the MAP model and observed line ratios are shown in Appendix B.1. Throughout the rest of the paper, we assume the values inferred as detailed in this section as our fiducial estimates on temperatures, density, and nebular attenuation.
4.3. Te-based chemical abundances
The simultaneous detection of both nebular and auroral lines in the spectrum enables us to perform a detailed study of chemical abundance patterns in this galaxy, employing the “direct” electron temperature (Te) method. In fact, once the temperature and density of the ionized gas are known, we can derive the relative ionic abundance of two elements comparing the intensity I(λ) in the emission lines of each species while taking into account the different temperature and density dependences of the volumetric emissivity of the transitions.
For this part of the analysis, we start from the posterior distributions of physical parameters derived in Section 4.2, and use them to infer “dependent” quantities, such as ionic abundances and their uncertainties, by applying the same methodology to all samples in the chain. When using emission lines not already folded in the original likelihood (such as [N II]λ6584, used to derive N/O), we generated 100 realizations of the flux per MCMC sample from a Gaussian distribution centered on the measured value and with σ equal to the observational error, such that the uncertainty on the flux is propagated onto the final derived quantity. The final corner plots resulting from this procedure are shown in Appendix B.2. Throughout this section, unless stated otherwise, we adopt PYNEB routines for the derivation of temperature and chemical abundances, with atomic data taken as default for all atoms but for O++ and He species, for which we adopt data from Palay et al. (2012) and Porter et al. (2013), respectively.
4.3.1. Oxygen, nitrogen, sulfur, neon, argon
To derive the total oxygen abundance, for each element of the MCMC chain, we compute the abundance of O++/H and O+/H from the dust-corrected [O III]λ5007/Hβ (assuming t = Te [O III]) and [O II]/Hβ (assuming t = Te [O II]) ratios, respectively. The total oxygen abundance is then O/H = O++/H + O+/H, delivering 12+log(O/H) = 8.15 . For other elemental species, we followed the same procedure described in the previous section to derive the ionic abundances of nitrogen (N), sulphur (S), neon (Ne), and argon (Ar) relative to those of oxygen (O). Where needed, we applied ionization correction factors (ICF) as parametrized by Amayo et al. (2021) on the basis of the oxygen ionization fraction, defined as ω = O++/(O++ + O+) =
  .
.
For nitrogen we inferred the abundance of N+/O+ by comparing the (dust-corrected) intensity [N II]λ6584 with that of [O II]3727, assuming t = Te[O II] and the density set by ne; after applying the ICF[N+/O+], we obtain a total log(N/O) =  . We observe sulfur emission originating from two different ionization states, namely S+ and S++. We derived the abundance of S+/O+ by comparing [S II] to [O II]3727, assuming t = Te[O II] and ne, while we infer S++/O++ from the [S III]λ9068/[O III]λ5007 ratio, assuming t = Te [O III]. The total S/O abundance is then given by S/O = (S++/O++ + S+/O+) × ICF[S++/O++ + S+/O+], delivering log(S/O) =
  . Finally, we compute the Ne++/O++ and Ar++/O++ abundance ratios comparing the intensity of [Ne III]λ3869 and [Ar III]λ7135 with that of [O III]λ5007, respectively, assuming the Te [O III] temperature for both ions and inferring log(Ne/O) =
  and log(Ar/O) =
  .
.
4.3.2. Helium abundance
To measure He+/H+ abundance (y+), we followed a similar approach to that of Section 4.2 and Equation (2), modeling the intensity ratio in a given He I line compared to Hβ as
 (3)
(3)
where E is the emissivity, “dust model” refers to the Reddy et al. (2025) formalism already implemented in Sect. 4.2, fλ is a correction term to take into account photons reabsorbed or scattered out of the line of sight (function of temperature, density, and optical depth τ), and the collisional-to-recombination ratio (C/R) corrects for the amount of neutral hydrogen and helium atoms excited to higher-energy states due to collisions with free electrons, being a function of the ratio of neutral-to-ionized hydrogen density ξ. Compared to other studies (e.g., Hsyu et al. 2020; Aver et al. 2021), here we do not include any corrections for the underlying absorption, as this is already accounted for in our continuum modeling and spectral fitting procedure.
In our analysis, we consider the following He I transitions: He I λ4472, λ4687, λ4923, λ5017, λ6679, λ7067, λ7283, and λ10832 (the latter being particularly sensitive to variations in electron density, see, e.g., Berg et al. 2026). In addition, we include the He Iλ3889+H8 complex as an individual emission line, taking into account radiative transfer effects for both transitions. We set up a similar MCMC as in Section 4.2, and include hydrogen lines in our modeling too, leaving again AV and fcov free to vary; the other free parameters in our model are y+, τ, and ξ.
Further details about the formalism adopted to include optical depth and C/R corrections, as well as on the adopted priors and results from the MCMC run, are provided in Appendix B. From marginalized posterior distributions, we infer an He+ abundance y+ = 0.085 . Because of our interpretation of the He IIλ4686 emission as primarily stellar in origin, we did not use its flux to correct for the doubly-ionized helium state, and we assume y+ as indicative of the total helium abundance y in the gas-phase, while noting that this could more likely represent a lower limit. Converting this value to the He mass fraction Y = 4y(1 − 20 × O/H)/(1 + 4y), we obtain Y = 0.253 ± 0.008, in good agreement with the measurements of local and high-z systems of metallicity comparable to M4327 (Aver et al. 2021; Berg et al. 2026).
4.3.3. Gas-phase and total iron-to-oxygen abundance
We derived the gas-phase (Fe/O)gas abundance from the [Fe III]λ4658 emission line. First, we infer the Fe++/O+ relative abundance from the [Fe III]λ4658/[O II]3728 ratio, assuming T = Te[O II] and the density derived from the [S II] doublet, which we then correct assuming the ICF(Fe) scheme provided by Rodríguez & Rubin (2005) based on the degree of ionization measured by O++/O+, obtaining log(Fe/O) . Furthermore, we derive the gas-phase Fe/N abundance by combining (Fe/O)gas with N/O, obtaining log(Fe/N)
 .
.
The determination of Fe abundance in the ISM is subject to several uncertainties, mostly related to the effect of iron depletion on dust grains and to the correction of unseen ionization states. In particular, the ICF for Fe++, based on photoionization models or on direct observations of emission from Fe+, Fe3+, and Fe4+ ions, is affected by large scatter (Rodríguez & Rubin 2005; Izotov et al. 2006). Other sources of uncertainty include uncertainties in the atomic parameters of Fe, and the effects of dust depletion, which can dramatically alter the observed metal abundances, especially for the most refractory elements (e.g., De Cia et al. 2016; Roman-Duval et al. 2022). For example, in the Milky Way ISM, 90 to 99% Fe is missing from the gas-phase but incorporated into the dust (Jenkins 2009). For a more thorough discussion of the systematics associated with the choice of ICF and other sources of uncertainties in the measurement of nebular Fe abundance, we refer to the discussion in Méndez-Delgado et al. (2024). Here, we conservatively account for such systematic uncertainties by incorporating an additional relative uncertainty of 20% on the ICF(Fe++), providing a final fiducial estimate of log(Fe/O) and log(Fe/N)
 .
.
In Fig. 6 we compare the position of M4327 on the (Fe/O)gas versus O/H plane with a distribution of star-forming galaxies with Te-based abundance measurements. In particular, gray points mark the sample compiled and analyzed by Méndez-Delgado et al. (2024) in the framework of the DESIRED project5, in violet we report a sample of starburst galaxies showcasing clear signatures of Wolf-Rayet stellar features from López-Sánchez & Esteban (2010), whereas squares mark extremely-metal poor (XMP) galaxies with WR activity from Izotov et al. (2017, 2018, 2021), Kojima et al. (2021) and, finally, the location of the LyC emitting complex in the lensed system Sunburst Arc at z ∼ 2.37 is marked by the red cross; in both panels, the black line marks the best-fit to the trend in the abundance patterns for the DESIRED sample (Méndez-Delgado et al. 2024).
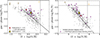 |
Fig. 6. Relative gas-phase Fe, O, and N abundance patterns. The position of M4327 in the log(Fe/O) vs 12+log(O/H) (left panel) and log(Fe/N) vs 12+log(N/H) (right panel) diagrams is compared with the distribution of local star-forming nebulae from the DESIRED project Méndez-Delgado et al. (2024), star-forming galaxies hosting WR features (López-Sánchez & Esteban 2010), extremely metal-poor galaxies with signatures of WR activity (J1205+4551, Izotov et al. 2017; J0811+4730, Izotov et al. 2018; J1631+4426, Kojima et al. 2021), and with the Sunburst Arc at z ∼ 2.37 (Rivera-Thorsen et al. 2024). Notably, almost all galaxies with WR signatures are characterized by an Fe-enhancement in the gas-phase compared to the average trend of local nebulae. |
According to Fig. 6, M4327 appears relatively enhanced in (Fe/O)gas compared to the bulk of local star-forming nebulae, occupying the upper envelope of the distribution of the DESIRED sample; remarkably, we note that such a behavior is common to almost all galaxies with WR features in their spectra. At the same time, despite showing evidence for enhancement in the (Fe/N)gas vs N/H diagram too, the offset of M4327 (and of WR galaxies in general) from the average trend of local galaxies is less pronounced (with M4327 being consistent with the best-fit curve of DESIRED galaxies within the uncertainties), reflecting the overall tighter relationship (as observed also in samples of MW stars) expected given the more similar production timescales of the two elements (Méndez-Delgado et al. 2024). We return to the possible implications of these findings in Sect. 5.2.2.
Taking advantage of the tighter relationship between Fe/N and N/H gas-phase abundances to establish a link between the relative dust depletion properties (as harder radiation fields, which scales inversely with Fe/H, are more likely to destroy dust grains), we can assume N/H as a proxy of the fraction of total Fe locked into dust grains. Applying Equation (1) from Méndez-Delgado et al. (2024), we infer a Fedust/Fetotal = 0.65, from which we derive a total Fe/O abundance of log(Fe/O)total = −1.61 ± 0.226 or, equivalently, [O/Fe] = 0.38 ± 0.22. Under the assumption that the Fe/O abundance measured in the ISM is representative of the stellar metallicity of the young stellar populations responsible for powering line emission, this would correspond to an alpha-enhancement approximately of a factor 2.4× the solar value.
5. Discussion
5.1. The Wolf-Rayet spectral features
5.1.1. Analysis of the blue and red bump
In the top panels of Figure 7 we visually compare the NIRSpec spectrum of M4327 in the region of the blue and red bumps with a set of synthetic single stellar population (SSP) models from BPASS v2.2.1 and v2.2.3 (with binary evolution enabled, Stanway & Eldridge 2018; Byrne & Stanway 2023), the latter allowing the elemental abundance ratios to vary compared to the solar composition, in particular regarding the enhancement of α-elements relative to Fe. In particular, the model spectra are generated by assuming a Chabrier (2003) IMF with high-mass cutoff = 300 M⊙, stellar metallicity Z = 0.20 Z⊙, and [α/Fe] = 0.47 (matching the oxygen abundance measured from the Te-method (Section 4.3) and following values typically observed at z ∼ 2, e.g., Topping et al. 2020; Cullen et al. 2021). Synthetic spectra from individual bursts of different ages (at various steps between 1 and 10 Myr, as detailed in the panel) are shown, after they have been normalized (at flux density at 4550 Å), convolved, and resampled to match the resolution of the NIRSpec data. We find that the He II feature is best reproduced by a single burst of age ∼6 Myr (solid lines), whose height and width nicely overlap with that of the observed bump; this assumes that the He II is purely stellar in origin, neglecting possible contributions from narrow, nebular He II components originating from photo-ionized gas. Younger bursts (with fixed other parameters) underpredict the strength of the stellar He II bump while, on the other hand, predicting a more prominent red bump at 5800 Å (which peaks at ∼3 Myr), which is not observed. The same applies to considering higher and/or lower metallicities at fixed age of the burst.
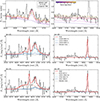 |
Fig. 7. Comparison of blue and red bump features in M4327 with SSP models and empirical templates. Upper panels: M4327 spectrum is compared with a set of SSP models from BPASS v2.2.1 for different burst ages, assuming a stellar metallicity of 20% Z⊙, a Chabrier (2003) IMF, an alpha-enhancement [α/Fe] = 0.4, and including binary evolution. The broad He II feature, if assumed purely stellar in origin, is well reproduced by a t ∼ 6 Myr-old burst (solid line), although these models under-predict the strength of the blue nitrogen features at ≈4620 − 4640 Å. Middle and bottom panels: M4327 spectrum is fitted with a combination of empirical WR template spectra from Crowther et al. (2023). The best-fit model in the middle panels include only stars of the WN type, whereas in the bottom panels we have included also WC stars; nebular emission lines are fitted separately with individual Gaussian components. |
The best-matching 6 Myr-old BPASS model contains a relative fraction of H-rich WR stars (WNh), nitrogen-rich (WN), and carbon-rich (WC) stars (over the total number of WR stars) of 62%, 29%, and 9%, respectively. However, we observe that such a model is not capable of reproducing the intensity of the nitrogen features observed at ≈4620 − 4640 Å, suggesting some level of nitrogen enhancement in the stellar atmospheres compared to the model spectrum. This is common to several SPS models (as noted already by Eldridge et al. 2017), in that the strength of the nitrogen emission is often underestimated compared to that observed in WR-host galaxies (e.g., Brinchmann et al. 2008a) as possibly caused by a non-proper treatment of stellar evolutionary tracks for the WR phase and/or by not including WR spectra for surface hydrogen mass fractions higher than a certain threshold, hence missing the contribution of WNh stars to the stellar lines (Mollá et al. 2009; Eldridge & Stanway 2009; Hainich et al. 2014; Martins & Palacios 2022).
We also attempted to reproduce the observed profile by fitting the spectrum with the set of empirical WR spectral templates by Crowther et al. (2023). We note that such templates are provided at a coarser resolution (10 Å) than the actual resolution of the NIRSpec data (∼5 − 7 Å in the rest-frame); therefore we do not perform any convolution of the M4327 spectrum before fitting, noting that information that can be retrieved from the fit is limited by the templates. We chose the templates provided for the Large Magellanic Cloud (LMC) (in light of its similar metallicity to M4327), and performed a simultaneous least-squares fit with a linear combination of stellar templates to the combined spectral regions hosting the blue (4550−4800 Å) and red (5600−6000 Å) bumps; the WR templates are converted into flux density units based on the luminosity distance of M4327, and complementary nebular line emission from [Fe III], He II, and He I were included in the model by manually adding individual, unresolved Gaussian components.
Based on the apparent strength of the stellar features He IIλ4686 and nitrogen, and on the insights from the stellar population synthesis models, we started by performing a fit including only WR templates of the WN type. The best-fit model reproduces well the broad He IIλ4686 feature, while only partially accounting for the nitrogen stellar wind lines between 4610−4640 Å, which are much weaker in the templates than observed. The total model, shown by the red curve in the middle panels of Fig. 7, results from a combination of early- and late-type He-burning WR stars of the nitrogen sequence (WN3-7s, WN6-8, and WN9-11). As seen in the right-hand panel, such templates do not contribute significantly to the red bump, which remains unfit. Although emission in the 5750 − 5800 Å range could possibly originate from a combination of stellar N IVλ5737 and Si IIIλ5740, and nebular N IIλ5755, WN6-8 templates do not produce significant contributions to the stellar component, and no narrow line emission is observed at λ5755.
Next, we ran a fit including also templates of WR stars of the early-type carbon sequence, namely WC4-5 (bottom panels of Fig. 7): these, however, tend to produce a relatively brighter bump at ≈5800 Å than at ≈5760 Å, as opposed to what observed in M4327, hence still delivering a poor fit to the whole red bump. At the same time, the inclusion of WC templates results in a strong contribution from these stars to the blue bump, which is now comparable to that of WN stars in the best-fit model, but that at the same time provides both a poorer match to the He II broad emission, and produces a broad feature that is partially degenerate with the narrow [Fe III]λ4658 nebular line (likely also a consequence of the coarser resolution of the templates compared to the NIRSpec data). Finally, we performed a fit by including different types of transition WR stars: we discuss the main insights from this analysis here and show the resulting best-fit models in Appendix C.
We conclude this section by noting that similar features have been recently observed in the LyC-emitting (LCE) cluster within the strongly lensed galaxy Sunburst Arc at a similar redshift (z ∼ 2.37) as M4327 (Rivera-Thorsen et al. 2024), and interpreted as possible evidence of proto-globular-cluster seeds hosting a large number of massive stars enriching the surrounding medium via the release of CNO-cycle H-burning products (see also, Pascale et al. 2023; Meštrić et al. 2023; Adamo et al. 2024): such an enrichment mechanism is among those proposed also to explain the strong nitrogen-enrichment level observed in several z ≳ 6 galaxies (e.g., Cameron et al. 2023; Charbonnel et al. 2023; Isobe et al. 2023; Topping et al. 2024; Curti et al. 2025). Similarly to Rivera-Thorsen et al. (2024), we speculate that the high star-formation rate density characterizing high-z galaxies could possibly result in an enhanced fraction of (possibly rotating) binaries evolving into WR stars with increased mass-loss rates, which compensates for the relatively low metallicity of high-redshift systems in driving the stellar winds required to enrich the ISM with nitrogen as N-enrichment is expected to scale with the wind strength, which in turn depends on the metallicity of the stellar atmospheres (e.g., Eldridge & Vink 2006). However, direct signatures of WR stars in the spectra of early galaxies are extremely challenging to detect (and indeed not observed as of yet), and therefore deep spectra of galaxies at Cosmic Noon such as M4327 can serve as useful observational benchmarks for stellar population models.
5.1.2. Wolf-Rayet or very massive stars?
An alternative scenario invokes the contribution from the class of “very massive stars” (VMS, M★ ≳ 100 M⊙). As proposed, for example, by Vink (2025), such stars are luminous WNh that evolve vertically in the Hertzsprung-Russell (HR) diagram to become classical WR stars (cWR) at later times, have large convective cores leading to chemically homogeneity, and are expected to drive strong, nitrogen-enriched stellar winds, making them robust candidates for polluting the surrounding ISM within the early phases of galaxy formation (due to their large mass-loss rates and relatively slow wind velocities). Moreover, they could also account for the strong He II emission, if the correct mass-loss rate is implemented at the optically thin-thick transition point (Vink et al. 2011; Vink & Gräfener 2012; Sabhahit et al. 2023). However, identifying spectral signatures of cWR from those of VMS is not trivial, especially in galaxies characterized by extended star-formation histories.
Here, we compare our observations with the empirical classification scheme discussed in Martins et al. (2023), based on the relative strength of blue and red bump optical features to discriminate the possible presence of VMS in M4327. This approach is based on observing that the spectra of a prototypical VMS host, such as the young stellar cluster R136 in the LMC, showcase strong He IIλ4686 emission, while having negligible N III 4640 + CIII 4650 (Hainich et al. 2014), the latter being also influenced by the relative abundance of N and C (hence by the metallicity); in contrast, cWR spectra have an N III 4640 + C III 4650 complex of comparable intensity to He IIλ4686. In Fig. 8, we report the location of M4327 on two of the diagnostic diagrams proposed by Martins et al. (2023), comparing the EW of the blue bump in the 4605−4650 Å complex with that of the red bump (measured within the [5780−5850 Å] wavelength interval, left-hand panel) and of He IIλ4686 (right-hand panel). In both panels, we report the sample of local sources compiled by Martins et al. (2023), color-coded according to the spectral classification discussed in that paper. Within these diagrams, M4327 occupies an intermediate region, but its features are more aligned to those observed in WR hosts than in VMS hosts, particularly in light of the comparable strength of the 4605−4650 Å and He II features in the blue bump (where EW[He IIλ4686 is generally much higher in VMS candidates), and of the typical weakness of the red bump in VMS spectra.
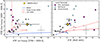 |
Fig. 8. Comparison between the EWs of the blue and red bump features. Left panel: EW of the blue bump (specifically, the 4605−4650 Å complex) versus the EW of the red bump complex (measured between 5780−5850 Å). Right panel: EW[4605−4650 Å] versus EW(He IIλ4686). The circle points report similar measurements for a sample of local galaxies where the presence of VMS (purple) of WR stars (blue) has been identified (or suggested). Gray points mark systems with no signatures of WR or VMS, or galaxies with He IIλ4686 detection but no robust classification. Blue tracks are BPASS models for single bursts of star-formation of different ages (from 1 to 10 Myr), whereas dashed and dot-dashed red tracks are models including VMS contribution for single bursts and constant star-formation, respectively. Data and VMS models compiled from Martins et al. (2023) (see also references therein). |
Applying such a classification approach to the spectrum of M4327 is nonetheless subject to several uncertainties (beyond those pertaining to the S/N of the involved features), including the “dilution” effect that the presence of multiple stellar populations and/or of nebular continuum emission can have on the WR and/or VMS spectrum, altering the inferred EWs. We also note that, in principle, BPASS models with an upper mass cutoff of 300 M⊙ include VMS, however the spectra used for VMS are the same as for normal OB and WR stars (Martins et al. 2023). Furthermore, as VMS and WN reach the CNO equilibrium in their atmospheres, their nitrogen content reflects the initial carbon content, which scales with metallicity. The relative strength of the nitrogen lines in the complex depends also on the ionization of the stellar atmospheres, with N V dominating at the highest Teff, as well as on the properties (and relative treatment in SPS models) of stellar winds and relative mass loss rates (Rivero González et al. 2011; Martins & Palacios 2022). In this sense, additional and complementary clues to the nature of the population of massive stars in this system (and more in general) might come from forthcoming observations of the rest-UV spectrum, as both stellar population synthesis models and observations suggest that the presence of strong (EW > 3 Å, and up to ∼30 Å) and broad (FWHM ≳ 1000 km s−1) He IIλ1640 emission and multiple, strong P-Cygni profiles for C IVλ1550, N IVλ1486, and N IVλ1720 stellar features could be indicative of the presence of VMS (Martins & Palacios 2022; Martins et al. 2023; Berg et al. 2024).
5.2. Chemical abundances and star-formation history
5.2.1. Abundance patterns
In Fig. 9 we report the location of M4327 in different abundance pattern diagrams, namely N/O versus O/H, Ne/O versus O/H, and O/Ar versus Ar/H (here used as a proxy of the metallicity). A sample of local galaxies and HII regions with Te-based abundances is also shown for comparison, as compiled from CHAOS (Berg et al. 2020), BOND (Vale Asari et al. 2016), and DESIRED (Méndez-Delgado et al. 2024) projects, and for which elemental abundances have been consistently re-computed adopting the same set of atomic parameters and assumptions as for M4327; in addition, the sample of star-forming galaxies with Wolf-Rayet spectral features presented in López-Sánchez & Esteban (2010) is shown by violet diamond markers. Within these panels, M4327 overlaps with the distribution of local systems and aligns with the expectations of standard chemical evolution models.
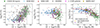 |
Fig. 9. Chemical abundance patterns. From left to right, we show the position of M4327 in the N/O vs. O/H, Ne/O vs. O/H, and O/Ar vs. Ar/H diagrams. A compilation of local galaxies and HII regions with Te-based abundance measurements from CHAOS (Berg et al. 2016), BOND (Vale Asari et al. 2016), and DESIRED (Méndez-Delgado et al. 2024) is shown for comparison, together with the sample of Wolf-Rayet galaxies from López-Sánchez & Esteban (2010). In the O/Ar vs. Ar/H diagram, we overplot the galactic chemical evolution tracks for the MW (solar neighborhood, orange) and the disc of M31 (between 3 and 14 kpc, purple) from Kobayashi et al. (2020) (see also, Arnaboldi et al. 2022). |
In the left-hand panel of Fig. 9 we investigate the log(N/O) vs log(O/H) pattern. We do not observe any evidence of significant N/O-enhancement above the expected level given the metallicity of M4327, which overlaps with the local distribution of galaxies (as well as with most z ∼ 2 galaxies of comparable metallicity with Te-based N/O measurements, see Cataldi et al. 2026). This implies that the population of massive stars in the WR phase has not significantly impacted the global ISM of the galaxy, and that the nitrogen observed in the form of N III wind lines in the blue bump is likely confined to the stellar atmospheres or their immediate surroundings. Although some past studies have suggested that winds from WR stars can cool and mix with the ISM on relatively shorter timescales compared to CC-SNe ejecta (Kobulnicky & Skillman 1997; López-Sánchez et al. 2007), the patterns observed in M4327 align with those of the WR galaxy sample with Te-based abundance measurements from López-Sánchez & Esteban (2010). Furthermore, systematic studies of large samples of galaxies from the Sloan Digital Sky Survey (SDSS) suggest that WR galaxies of high EW(Hβ) (hence, systems with prevalence of young stellar populations) do not show any significant enhancement in N/O (at fixed O/H) compared to sources with the same EW(Hβ) but without WR features in their spectra, in contrast to what is more commonly observed at low-metallicity and low-EW(Hβ) (Brinchmann et al. 2008a).
In the previous section, we have seen that the presence of N III features in the blue bump (together with the absence of strong C lines) suggests that the WR population in M4327 is dominated by WN. As WN stars are expected to be at (or close to) the CNO equilibrium in their atmospheres (Crowther 2000, 2007), one could also expect an elevated He/H abundance (Kobulnicky et al. 1997), which would be, however, reflected into ISM abundances only if efficient helium mass-loss mechanisms (associated, for example, with rotational mixing) are in place and wind mixing timescales into the ISM are short enough. The absence of any significant He/H enhancement in the ISM of M4327 again suggests that either WR spectral features have shown up in the spectrum before enrichment becomes detectable on global ISM scales (being associated with a young ∼5 Myr old burst), that the enrichment is strongly localized, and/or that such a young population includes binaries (with not fully stripped and partially CNO-processed H-envelopes) formed in “intermediate” (≈0.5 Z⊙) metallicity environments (Götberg et al. 2017), as predicted, for example, by BPASS models (Eldridge et al. 2017, see also the previous section). At the same time, it is also possible that the N/O abundance inferred from the low-ionization [N II] species provides only a partial representation of the full chemical structure of M4327 and that, in the presence of multiple emitting regions of different chemical properties (“chemical stratification”), any nitrogen enrichment due to WR stars might be visible only in high-ionization nitrogen lines (emitted in the rest-frame UV) probing the region more closely surrounding such population, in a way not dissimilar to that observed (or postulated) in some galaxies at higher redshift (e.g., Pascale et al. 2023; Ji et al. 2024).
The middle panel of Fig. 9 reports the location of M4327 on the Ne/O versus O/H diagram. This source aligns with the local distribution of galaxies, reflecting the common nucleosynthetic origin of the two elements (since neon is an α-element like oxygen, their ratio is not expected to vary significantly with metallicity, nor to evolve with redshift, see, e.g., Arellano-Córdova et al. 2022; Stanton et al. 2025).
Finally, we explore the behavior of M4327 in terms of its argon-to-oxygen abundance ratio. The argon enrichment is in fact expected to partially follow that of iron in galaxies, in virtue of a non-negligible contribution from SNe-Ia; therefore, the O/Ar abundance ratio has been identified as a good proxy of O/Fe, reflecting the level of α-enhancement and its connection to the timescales of star-formation and chemical evolution (e.g., Arnaboldi et al. 2022; Bhattacharya et al. 2025; Stanton et al. 2025). On the O/Ar versus Ar/H diagram (right-hand panel of Fig. 9, and proxy for O/Fe versus Fe/H), M4327 follows the trend outlined by local galaxies and chemical evolution models of the solar neighborhood (orange track) and the M31 disc (modeled between 3 and 14 kpc, purple track) (Kobayashi et al. 2020; Arnaboldi et al. 2022), occupying the region around the “knee” of the relationship where the contribution of SNe-Ia starts to be significant and the abundance pattern deviates from the plateau expected for pure CC-SNe enrichment. More specifically, the chemical evolution model track of the solar neighborhood from Kobayashi et al. (2020) crosses the M4327 value on the O/Ar versus Ar/H diagram at a time of ∼3.4 Gyr after the initial burst of star-formation, closely matching (considering the uncertainties involved) the age of the Universe at the source redshift, i.e., ∼2.96 Gyr.
5.2.2. Wolf-Rayet, Fe enrichment, and dust depletion
In Fig. 6, we have seen that the gas-phase Fe/O abundance as measured in M4327 is higher than the average trend followed by local nebulae, given its oxygen abundance. Interestingly, a similar behavior can be observed in other sources with identified Wolf-Rayet spectral features, including the low-metallicity, nitrogen-enhanced LyC emitter in the Sunburst Arc at z ∼ 2.37 (Rivera-Thorsen et al. 2024; Welch et al. 2025), some extremely-metal-poor galaxies in the local Universe (e.g., J0811+4730, Izotov et al. 2018; J1631+4426, Kojima et al. 2021; J1205+4551, Izotov et al. 2017, 2021, and the sample of WR galaxies from López-Sánchez & Esteban 2010; these are also shown in Fig. 6). We can hence speculate about the possible role of WR stars in boosting Fe abundance at low-to-moderate metallicity over short star-formation timescales.
In the atmosphere of WN stars, nitrogen is quickly enriched at the expense of oxygen, potentially leading to a localized enrichment of the ISM with nitrogen via strong winds (Abbott & Conti 1987; Maeder et al. 2014; López-Sánchez et al. 2012). At the same time, these processes would affect the Fe/O ratio while keeping the Fe/N ratio almost constant, thus suggesting a possible link between regions with enhanced N/O abundances, relatively high (Fe/O)gas, and the presence of WR stars (Méndez-Delgado et al. 2024). However, we have seen that the N/O abundance measured in M4327 from optical lines (likely tracing the global galaxy ISM as probed by the integrated NIRSpec spectrum) is not particularly elevated compared to the distribution of local galaxies.
Instead, a plausible scenario for M4327 links the enhanced gas-phase Fe/O abundance with dust destruction, either via shocks or intense radiation fields possibly associated with the WR population (Jones et al. 1996; Izotov et al. 2006). These could possibly displace and destroy dust grains, releasing the previously depleted Fe into the gas-phase, and producing a transient boost in gas-phase Fe/O. Strong Fe enhancements (by about one dex) have been, for instance, observed in gamma-ray burst host galaxies (e.g., Waxman & Draine 2000; De Cia et al. 2012), suggesting a very recent and isolated episode of massive star-formation that caused dust destruction. This scenario would also be reflected in a lower dust mass and dust-to-metal ratio in the proximity of the WR population.
An alternative scenario instead invokes more exotic rapid Fe-enrichment mechanisms. In extreme, very localized starbursts, some CC-SNe (especially from massive progenitors, > 30 M⊙) may contribute iron group elements. This could be in the form of “Hypernovae” and/or “metal-rich fallback SNe”, or “stripped-envelope SNe” (e.g., Nomoto et al. 2006; Tominaga et al. 2007; Nomoto et al. 2013), locally elevating the gas-phase Fe/O before SNe Ia contributes on longer timescales, while dust formation proceeds normally and the dust mass should be consistent with the inferred metal content. Forthcoming ALMA observations probing the dust properties in M4327 will help to distinguish among these scenarios.
5.2.3. Fe/O abundance and specific star formation rate
In virtue of their different production and release timescales, the relative iron-to-oxygen [Fe/O] abundance ratio can be used to constrain the star-formation history of galaxies. Because of the intrinsic challenges associated with the direct measurement of stellar Fe abundances in high-z systems from rest-UV stellar winds and continuum features, such an investigation is still limited to a few individual cases, relies heavily on stacking techniques, or it is based on indirect inference from SSP modelling aimed at reproducing optical line ratios (e.g., Sommariva et al. 2012; Steidel et al. 2016; Strom et al. 2018; Topping et al. 2020; Cullen et al. 2021; Calabrò et al. 2021).
Alternatively, Chruślińska et al. (2024) proposed that the relationship between [O/Fe] and the specific star formation rate (sSFR) in galaxies (the latter probing the timescales of galaxy formation, and hence also of enrichment) could be used to indirectly guess the metallicity (in terms of Fe/H) of young stars, once the oxygen abundance is known (and modulate the systematic uncertainties on the normalization of the oxygen abundance scale due to the abundance discrepancy factor (ADF, e.g., Méndez-Delgado et al. 2023). Such a relationship is expected to be universal (i.e., redshift invariant), with systems of different ages and chemical maturity probing different regions of the [O/Fe] versus sSFR plane, and it is also observed in good agreement with the same relationship derived for stars in the MW disk (for relatively young and metal rich stars) and MW halo (probing older and metal poor stars), once a sSFR value is assigned based on the stellar age and under a given parametrization of the MW star-formation history (Chruślińska et al. 2024). Direct measurements of both quantities in high-z systems not only help to validate such a relationship, but also help constrain the underlying physics, including the yields of core-collapse SNe (mainly responsible for oxygen enrichment) and the time-delay and progenitors’ properties of type-Ia SNe (main sources of iron enrichment), as different prescriptions on such parameters have been demonstrated to produce relatively different shapes of the [O/Fe] versus sSFR relationship in cosmological simulations such as EAGLE (Schaye et al. 2015) and TNG (Nelson et al. 2019).
This is shown in Fig. 10, where we populate the [O/Fe] versus sSFR diagram with a combined sample of MW stars, local galaxies, and high-z sources where both oxygen and iron abundances have been derived by means of either direct or indirect methodologies, and which have been reported to a common baseline tied to Te-based, gas-phase oxygen abundance (corrected for oxygen depletion onto dust, where needed) and BPASS stellar population synthesis-based Fe abundance measurements, respectively (see Chruślińska et al. 2024, for a detailed discussion on the involved systematic uncertainties and on how to convert these measurements to a common abundance scale for Fe and O). Once accounting for the residual fraction of Fe depleted onto dust grains (Sect. 4.3.3), M4327 aligns with galaxies of similar sSFR and redshift, representing one of the few high-z sources with self-consistent gas-phase probes of both quantities.
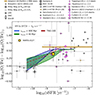 |
Fig. 10. [O/Fe] versus sSFR relationship for galaxies. The location of M4327 is reported alongside a literature sample comprised of nearby dwarf galaxies, local galaxies with blue supergiant-based metallicity estimates, extremely metal-poor dwarf galaxies, and high-redshift star-forming galaxies/stacks, as presented in Chruślińska et al. (2024) (see the legend, and references therein). M4327 represents, together with the Sunburst Arc, the only high-z galaxy with Te-based determination of both gas-phase oxygen and Fe abundances (the latter corrected to total Fe/O abundance as detailed in Sect. 4.3.3). The hatched bar indicates the average abundance ratio of the MW thick disc and/or halo dwarf stars with [Fe/H] < −2 from Amarsi et al. (2019), whereas hatched symbols mark high-z galaxies with indirect determination of stellar metallicity (Fe/H) via modeling of optical lines. Shaded areas represent the model [O/Fe]–sSFR relation derived as detailed in Chruślińska et al. (2024) (see their Eq. 1) for different assumptions on the SN Ia delay-time distribution, namely a power-law DTD with slope equal to −1.1 with τIa, min = 400 Myr (blue) and 40 Myr (green); upper and/or lower curves of the same color correspond to different choices of the relative iron yield of SN Ia and CCSN, namely CIa/CC = 0.74 and 2.5, respectively. The brown, dashed line marks the same relationship as obtained in TNG100 simulations with fIa ∝ −1.12 and CIa/CC = 2.04. |
In Fig. 10 we also plot different models of the [O/Fe] versus sSFR relation for galaxies, derived by means of different assumptions on the delay-time distribution of SN Ia, Fe yields of CC-SNe, and the shape of the star-formation history of galaxies. At the sSFR of M4327 (log(sSFR) = −8.5, corresponding to a characteristic timescale of star-formation τSF ∼ 315 Myr), enrichment from SNe Ia is expected to start contributing significantly. Here, we model the [O/Fe] versus sSFR relationship as described in Kashino et al. (2022) and Chruślińska et al. (2024) (see their Eq. 1), assuming a specific power-law parametrization for the SN Ia delay-time distribution (DTD) of the form fIa ∝ t−1.1 (Maoz & Graur 2017), noting, however, that the exact shape is strongly sensitive to the formational channels and progenitors of SN Ia (e.g. Nelemans et al. 2013). Different minimum SN Ia delay times8τIa, min = 40 and 400 Myr correspond to green and blue tracks, respectively (this means that fIa = 0 for t < τIa, min), whereas at fixed color (hence, fixed choice of τIa, min), the shaded areas encompass the relationships predicted by varying another critical parameter, i.e., the relative iron yield of SNe Ia to CC-SNE, CIa/CC, which is assumed equal to CIa/CC = 0.74 and 2.5 for upper and lower curves, respectively. In addition, we plot (as the dashed brown curve) the [O/Fe] versus sSFR relationship predicted within TNG-100 simulations for galaxies that obey the evolving star-forming main sequence (SFMS) from (Kashino et al. 2022) up to z ∼ 8, with a SN Ia DTD of the form fIa ∝ t−1.129, and by integrating Eq. (1) from Chruślińska et al. (2024) with the set of parameters reported in their Table A.1 (see, also, Schaye et al. 2015; Pillepich et al. 2018; Naiman et al. 2018). The general expected behavior is that longer τIa, min timescales produce a turnover in the relationship that occurs at the high end in sSFR, whereas the relative iron production efficiency of CC-SNe and SN Ia (the former highly uncertain in both observations, e.g., Anderson 2019; Rodríguez et al. 2023, and models, e.g., Woosley & Heger 2007; Sawada & Suwa 2023; Imasheva et al. 2023) impacts the steepness of the relationship and the saturation [O/Fe] value at the low sSFR end. In this sense, and while acknowledging the large systematic uncertainties affecting its [O/Fe] determination, if taken at face value M4327 overlaps with the set of curves obtained by assuming shorter values for τIa, min = 40 Myr, falling in the steep region of the relationship beyond the turnover knee.
5.3. Ionized gas outflow
In Sect. 3.4 we have reported the detection of a broad and slightly blue-shifted kinematical component under the Hα emission line. If we interpret such a component as tracing outflowing gas powered by star-formation, we can estimate the ionized–phase mass outflow rate and mass loading factor using the standard Case B framework (e.g., Genzel et al. 2011; Förster Schreiber et al. 2019). We discuss an alternative (while more speculative) origin of the broad Hα component (as associated to the presence of an intermediate-mass black hole) in Appendix D.
Assuming a conical and approximately steady outflow with outer radius Rout, constant velocity v, and electron density ne, the ionized mass and mass outflow rate are
 (4)
(4)
where γHα is the Hα volume emissivity (function of Te) and μ = 1.36 mp accounts for the mass of helium. In the case of M4327, we adopt Rout = 1 kpc, given that the size of the outflow is unresolved in the 1D NIRSpec spectrum, Te = Te [O III], and ne derived from the narrow [S II] emission as our fiducial assumptions for the outflow–rate calculations.
We derived the mass loading factor referenced to the local star-formation rate derived from the Hα emission within the slit as
 (5)
(5)
We compute SFRslit from the narrow Hα luminosity adopting the Kennicutt & Evans (2012) calibration converted to a Chabrier IMF, and assuming the same nebular attenuation for the narrow and broad components. We also corrected the measured FWHM of the broad component for the NIRSpec/G235H instrumental line-spread function computed at the observed Hα wavelength, i.e., σinst = 56 km s−1, obtaining an intrinsic FWHMint = 425 km s−1, and adopted two common definitions for the outflow velocity in the literature, e.g., from Rupke et al. (2005), Fiore et al. (2017)
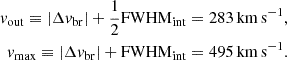 (6)
(6)
We obtain Ṁout(vout) = 4.38 M⊙ yr−1 and Ṁout(vmax) = 6.69 M⊙ yr−1, which translates into η(vout) = 0.155 and η(vmax) = 0.271. These values sit within the SF-driven regime and are in line with that reported for main-sequence galaxies at similar redshift and stellar mass regimes10 (Förster Schreiber et al. 2019), while ≈10× higher than observed in local dwarf galaxies (Marasco et al. 2023). This implies that, although the observed outflow is injecting a nonnegligible amount of momentum and energy into the surrounding ISM, it is unlikely to impact the global star-formation rate or drive wholesale removal of the ISM from the galaxy: the momentum and energy rates we infer are comparable to those expected from stellar feedback, but fall short of the values required to unbind the total gas reservoir. The impact on gas-phase metallicity is uncertain, as even modest-velocity winds can transport metals to larger radii and enrich the circumgalactic medium (Tumlinson et al. 2017). Cosmological simulations such as FIRE (Muratov et al. 2015) and TNG50 (Nelson et al. 2019) predict total mass loading factors of the order of unity to tenths for ∼109 M⊙. However, we note that since we are only probing the warm ionized gas-phase from Hα, our inferred mass outflow rate is a lower limit and the true total (multiphase) outflow rate could be significantly higher if outflows are present in the cooler, molecular gas (Cicone et al. 2014) and/or hotter, ionized plasma (Strickland & Heckman 2009) phases.
5.4. Alternative excitation mechanisms: Interpreting the presence of the O I λ8446 emission line
In Sect. 3.3 we reported the detection of the permitted O Iλ8446 emission line in M4327, representing one of the first of its kind in individual star-forming galaxies at high redshift. From a physical point of view, such line emission can arise through multiple excitation mechanisms, including Lyβ fluorescence, collisional excitation in partially ionized regions, and pumping by stellar continuum (Grandi 1980). Given the star-forming nature of our source and the absence of AGN-like features in the nebular spectrum (as suggested by all classical line-ratio diagnostic diagrams), we consider below what other processes could plausibly explain the observed strength of O Iλ8446.
First, we note that no emission is observed in the O Iλ7776 and O Iλ7990 lines; in particular, we derive a 3σ upper limit of ≈0.4 in both O Iλ7776/λ8446 and O Iλ7990/λ8446 line ratios. From these values, we can robustly exclude recombination as the mechanism responsible for powering O Iλ8446 (since in such a case the O Iλ7776/λ8446 ratio is expected to be ≈1.7), whereas the inferred upper limits are still consistent with expected line ratios predicted for Case B by Grandi (1980) for collisional excitation (O Iλ7776/λ8446 ≈ 0.3) and stellar continuum fluorescence (O Iλ7790/λ8446 ≈ 0.05); therefore, in this sense they are not fully conclusive.
On the other hand, Lyβ-pumping is another relevant mechanism that can possibly explain the presence (and relative strength) of the O Iλ8446 emission in astrophysical contexts. In fact, accidental resonance11 between Lyβ and the OI 2p4 3P2 − 3d 3D0 transition can pump the 3d 3D0 level12, which can then produce O I transitions at λ1304, λ8446, and λ11287 via recombination cascade (Netzer & Penston 1976; Grandi 1980). In this sense, the absence of strong O Iλ7774, O Iλ7254, and O Iλ7790 emission in the M4327 spectrum supports this scenario (though, as seen, our data do not allow us to fully discriminate Lyβ from stellar continuum fluorescence).
To produce O Iλ8446 emission via Lyβ pumping, it is required to have a combination of dense neutral oxygen and intense UV radiation. In terms of possible astrophysical sources, it has recently been suggested that analog configurations to Weigelt blobs observed in the proximity of luminous blue variable stars in the MW such as η Carinae might explain the strong OI λ8446 emission in the highly magnified stellar system dubbed “Godzilla” within the Sunburst Arc (Choe et al. 2025). These high density (∼107 cm−3) gas condensations are self-shielded from ionization and remain neutral or partially neutral in their interiors, while having an ionized surface layer facing the stars. The neutral O I is hence exposed to Lyβ photons emitted from the ionized surface of the blob, as well as from stellar winds, populating the 3d 3D0 level of neutral oxygen atoms13.
Whether similar structures also exist in the proximity of young populations of massive WR and/or O stars (and what characteristic O Iλ8446/7774 line ratios should they produce) is not completely clear. Here, we just note that no evidence of WR or VMS is reported, for example in the Godzilla stellar complex (Choe et al. 2025), contrary to what was observed in the LyC-emitting cluster within the same Sunburst Arc (Meštrić et al. 2023; Rivera-Thorsen et al. 2024), and that evidence for Bowen fluorescence associated with WR stars is generally scarce. Furthermore, no evidence for Lyα-pumped Fe II lines at λ 4853, 8490 is found in M4327, while these lines are brighter than O Iλ8446 in Weigelt blobs due to the Fe II laser mechanism (Johansson & Letokhov 2004; Davidson & Humphreys 2012). At the same time, the absence of very high-ionization emission lines in the optical spectrum of M4327 and the derived nebular line ratios disfavor alternative scenarios associated with AGNs (Grandi 1980), planetary nebulae (Rudy et al. 1992), or supernova remnants (Oliva 1993). Observations of additional emission lines arising from the same neutral oxygen pumping cascade, such as the UV O Iλ1304 multiplet and NIR O Iλ11287, 13165 lines (not currently available for this system), together with diagnostics sensitive to higher density gas, might provide further compelling evidence in favor (or disfavor) of the Lyβ fluorescence scenario.
Finally, fast shocks from WR stellar winds and/or X-ray heating from high-mass X-ray binaries (HMXBs) could offer an alternative source of localized excitation. Shock models from Allen et al. (2008) predict enhanced [O I] emission at velocities vs ≳ 150 km/s, particularly when preshock densities are high. In such environments, the partially ionized zones behind the shock front are capable of producing strong collisional excitation of neutral oxygen lines, although we note that large-scale shocks in M4327 are ruled out by the observed global [O I]λ6300/Hα line ratio, suggesting that [O I]λ6300 likely traces extended photoionized structures.
We can hence imagine a plausible scenario in which localized, dense gas condensations (e.g., Weigelt-blob analogs) are illuminated by nearby young stellar populations and processed by feedback, producing the WR spectral features, dominating the O I emission (from a combination of fluorescence and collisional excitation), and enhancing the inferred gas-phase Fe via dust grain (partial) destruction, leading to the apparent (Fe/O)gas enhancement (Sect. 4.3.3). At the same time, the global nebular spectrum, probing the large-scale galaxy ISM and reflected into the inferred strong-line ratios, nebular attenuation, and chemical abundance patterns, remains consistent with the typical star-formation process in a z ∼ 2 galaxy. Overall, these findings illustrate how the spatial and structural complexity of the ISM in compact, highly star-forming galaxies at high redshift (and, in particular, the possible presence of dense structures embedded within or near the star-forming complexes) can give rise to emission features that depart from the classical physical modeling of H II regions, even in galaxies that would appear otherwise unremarkable according to traditional diagnostics.
6. Summary and outlook
We have presented deep JWST/NIRSpec spectroscopy in G140M/F100LP, G235M/F170LP, and G235H/F170LP of the galaxy MARTA-4327 at z = 2.224, targeted as part of the MARTA-GO JWST programme (Figs. 1 and 2). We report one of the highest-redshift detections to date of the Wolf–Rayet (WR) blue and red bumps in a non-lensed galaxy (Fig. 3), and study the interplay between the presence of such massive stars, the elemental abundance patterns (derived via the Te-method thanks to the detection of multiple auroral lines), dust properties, and feedback in this system at Cosmic Noon. Our main results can be summarized as follows.
-
The broad He IIλ4686 feature in the blue bump is well reproduced by a population of WN stars associated with a recent (∼5−6 Myr) burst of star formation, whereas both stellar population synthesis models and empirical templates fall short in matching the observed strength of nitrogen stellar wind lines at ≈4640 Å, suggesting additional N-enhancement in the stellar atmospheres that is not fully accounted for by models (Fig. 7, see also Fig. C.1).
-
The relative strength of the blue and red bumps disfavor the presence of VMS in this system (which are generally characterized by much higher EW[He IIλ4686] than seen in M4327, Fig. 8), although a more definitive assessment will likely require joint analysis of rest-UV and rest-optical features.
-
We do not find any evidence for strong deviations (e.g., N/O-enhancement) in most elemental abundance patterns compared to the global trends inferred for star-forming galaxies of similar metallicity in the local Universe, including z ∼ 0 starbursts with detected WR features (Fig. 9). This suggests that any ISM enrichment from WR-driven stellar winds is highly localized and confined to their immediate surroundings, having negligible impact on the global ISM enrichment properties inferred from the integrated galaxy spectrum.
-
However, the gas-phase Fe/O ratio appears enhanced relative to local galaxies of comparable metallicity (Fig. 6). We interpret this as evidence of reduced Fe depletion, possibly linked to dust grain destruction in WR-driven environments.
-
After correcting our measurement of (Fe/O)gas (one of the first Te-based at high redshift) to (Fe/O)total, M4327 agrees well with the [O/Fe]–sSFR relationship for galaxies (Fig. 10), formally matching the expected relationship for relatively short (∼40 Myr) SN Ia minimum delay times. This demonstrates the potential of joint O and Fe abundance measurements in constraining star-formation histories and SN Ia delay-time distributions at high redshift.
-
The detection of a broad Hα component in the G235H spectrum, blueshifted by ∼70 km s−1 (Fig. 4), suggests the presence of an ionized outflow with a mass loading factor η ∼ 0.2. Although consistent with previous studies of star-formation-driven winds in z ∼ 2 galaxies (and significantly larger than in local dwarfs), such an outflow is likely insufficient to expel the ISM from the galaxy on global scales. At the same time, we note that the total multiphase outflow rate may be larger, since molecular and hot gas phases are not probed by our data.
-
We report the detection of O Iλ8446 emission at ∼8σ significance, among the first such detections in a high-redshift star-forming galaxy. Although recombination origin can be excluded, both Lyβ fluorescence and collisional excitation in dense neutral clumps (similar to Weigelt blobs observed in η Carinae) remain plausible (while not mutually exclusive) excitation channels, with additional contributions from localized shocks also possible.
Looking forward, future works on either this source and, more broadly, on galaxy populations at Cosmic Noon might benefit from the following.
-
Expanding the sample of galaxies with deep, medium-high resolution JWST/NIRspec spectroscopy, to search for signatures of massive stars, perform more robust (direct) Fe abundance measurements, and establish whether the enhanced (Fe/O)gas observed in M4327 is a common property of WR hosts at high redshift.
-
High-resolution, deep rest-UV spectroscopy, which can provide additional constraints on the nature of the massive stellar populations (WR vs. VMS) and on localized chemical enrichment as probed by ionic species of different ionization.
-
Probing multi-phase outflow and dust properties from ALMA observations, to provide a full census of the interplay between metal enrichment, dust, and feedback.
-
Spatially resolved observations, providing a more robust physical connection between abundance patterns, dust properties, O I emission, and the spatial regions associated with massive stars (or, possibly, with intermediate mass-black holes, see Appendix D).
Taken together, M4327 highlights the unique capability of deep JWST/NIRSpec spectroscopy in unveiling the interplay between star formation and ISM properties in galaxies at Cosmic Noon. The opportunity to measure Te-based abundances of multiple elements, constrain the dust properties, and detect signatures of massive stars in “normal” star-forming galaxies provides a strong benchmark for testing stellar population models, chemical enrichment pathways, and feedback mechanisms in young, actively star-forming systems, shedding unprecedented light onto the life cycle of dust and metals during the epoch of peak cosmic star-formation activity.
Acknowledgments
MC acknowledges support from ESO via the ESO Fellowship Europe. FB and FM acknowledge support from the INAF Fundamental Astrophysics programme 2022 and 2023. FM and AM acknowledge support from the European Union with the Next Generation EU plan, Mission 4, through PRIN-MUR project “PROMETEUS” (202223XPZM), CUP C53D2300080-006. AM acknowledges INAF funding through the “Ricerca Fondamentale 2023” program (mini-grant 1.05.23.04.01). WMB acknowledges support from DARK via the DARK Fellowship. GC acknowledges financial support from INAF under the Large Grant 2022 “The metal circle: a new sharp view of the baryon cycle up to Cosmic Dawn with the latest generation IFU facilities”. A.F. acknowledges the support from project “VLT- MOONS” CRAM 1.05.03.07. FC acknowledges support from a UKRI Frontier Research Guarantee Grant (PI Cullen; grant reference EP/X021025/1). CK acknowledges funding from the UK Science and Technology Facility Council through grant ST/Y001443/1. This work is based on observations made with the NASA/ESA/CSA James Webb Space Telescope. The data were obtained from the Mikulski Archive for Space Telescopes at the Space Telescope Science Institute, which is operated by the Association of Universities for Research in Astronomy, Inc., under NASA contract NAS 5-03127 for JWST. These observations are associated with program JWST 1879.
References
- Aadland, E., Massey, P., Hillier, D. J., & Morrell, N. 2022, ApJ, 924, 44 [Google Scholar]
- Abbott, D. C., & Conti, P. S. 1987, ARA&A, 25, 113 [NASA ADS] [CrossRef] [Google Scholar]
- Adamo, A., Bradley, L. D., Vanzella, E., et al. 2024, Nature, 632, 513 [NASA ADS] [CrossRef] [Google Scholar]
- Allen, M. G., Groves, B. A., Dopita, M. A., Sutherland, R. S., & Kewley, L. J. 2008, ApJS, 178, 20 [Google Scholar]
- Amarsi, A. M., Nissen, P. E., & Skúladóttir, Á. 2019, A&A, 630, A104 [NASA ADS] [CrossRef] [EDP Sciences] [Google Scholar]
- Amayo, A., Delgado-Inglada, G., & Stasińska, G. 2021, MNRAS, 505, 2361 [CrossRef] [Google Scholar]
- Anderson, J. P. 2019, A&A, 628, A7 [NASA ADS] [CrossRef] [EDP Sciences] [Google Scholar]
- Arellano-Córdova, K. Z., Berg, D. A., Chisholm, J., et al. 2022, ApJ, 940, L23 [CrossRef] [Google Scholar]
- Arellano-Córdova, K. Z., Cullen, F., Carnall, A. C., et al. 2025, MNRAS, 540, 2991 [Google Scholar]
- Arnaboldi, M., Bhattacharya, S., Gerhard, O., et al. 2022, A&A, 666, A109 [NASA ADS] [CrossRef] [EDP Sciences] [Google Scholar]
- Asplund, M., Amarsi, A. M., & Grevesse, N. 2021, A&A, 653, A141 [NASA ADS] [CrossRef] [EDP Sciences] [Google Scholar]
- Aver, E., Olive, K. A., & Skillman, E. D. 2010, JCAP, 2010, 003 [CrossRef] [Google Scholar]
- Aver, E., Olive, K. A., & Skillman, E. D. 2011, JCAP, 2011, 043 [Google Scholar]
- Aver, E., Berg, D. A., Olive, K. A., et al. 2021, JCAP, 2021, 027 [CrossRef] [Google Scholar]
- Berg, D. A., Skillman, E. D., Henry, R. B. C., Erb, D. K., & Carigi, L. 2016, ApJ, 827, 126 [NASA ADS] [CrossRef] [Google Scholar]
- Berg, D. A., Pogge, R. W., Skillman, E. D., et al. 2020, ApJ, 893, 96 [NASA ADS] [CrossRef] [Google Scholar]
- Berg, D. A., Skillman, E. D., Chisholm, J., et al. 2024, ApJ, 971, 87 [NASA ADS] [Google Scholar]
- Berg, D. A., Sanders, R. L., Shapley, A. E., et al. 2026, ApJ, 996, 68 [Google Scholar]
- Bhattacharya, S., Arnaboldi, M., Gerhard, O., Kobayashi, C., & Saha, K. 2025, ApJ, 983, L30 [Google Scholar]
- Bian, F., Kewley, L. J., & Dopita, M. A. 2018, ApJ, 859, 175 [CrossRef] [Google Scholar]
- Brinchmann, J., Kunth, D., & Durret, F. 2008a, A&A, 485, 657 [NASA ADS] [CrossRef] [EDP Sciences] [Google Scholar]
- Brinchmann, J., Pettini, M., & Charlot, S. 2008b, MNRAS, 385, 769 [NASA ADS] [CrossRef] [Google Scholar]
- Byrne, C. M., & Stanway, E. R. 2023, MNRAS, 521, 4995 [NASA ADS] [CrossRef] [Google Scholar]
- Calabrò, A., Castellano, M., Pentericci, L., et al. 2021, A&A, 646, A39 [EDP Sciences] [Google Scholar]
- Cameron, A. J., Katz, H., Rey, M. P., & Saxena, A. 2023, MNRAS, 523, 3516 [NASA ADS] [CrossRef] [Google Scholar]
- Cappellari, M. 2017, MNRAS, 466, 798 [Google Scholar]
- Cappellari, M. 2023, MNRAS, 526, 3273 [NASA ADS] [CrossRef] [Google Scholar]
- Cappellari, M., & Emsellem, E. 2004, PASP, 116, 138 [Google Scholar]
- Cardelli, J. A., Clayton, G. C., & Mathis, J. S. 1989, ApJ, 345, 245 [Google Scholar]
- Carnall, A. C., Cullen, F., McLure, R. J., et al. 2024, MNRAS, 534, 325 [NASA ADS] [CrossRef] [Google Scholar]
- Cataldi, E., Belfiore, F., Curti, M., et al. 2025, A&A, 703, A208 [NASA ADS] [CrossRef] [EDP Sciences] [Google Scholar]
- Cataldi, E., Belfiore, F., Curti, M., et al. 2026, A&A, 709, A19 [Google Scholar]
- Chabrier, G. 2003, PASP, 115, 763 [Google Scholar]
- Chakraborty, P., Sarkar, A., Smith, R., et al. 2025, ApJ, 985, 24 [Google Scholar]
- Charbonnel, C., Schaerer, D., Prantzos, N., et al. 2023, A&A, 673, L7 [NASA ADS] [CrossRef] [EDP Sciences] [Google Scholar]
- Choe, S., Emil Rivera-Thorsen, T., Dahle, H., et al. 2025, A&A, 698, A16 [NASA ADS] [CrossRef] [EDP Sciences] [Google Scholar]
- Christensen, L., Laursen, P., Richard, J., et al. 2012, MNRAS, 427, 1973 [NASA ADS] [CrossRef] [Google Scholar]
- Chruślińska, M., Pakmor, R., Matthee, J., & Matsuno, T. 2024, A&A, 686, A186 [NASA ADS] [CrossRef] [EDP Sciences] [Google Scholar]
- Cicone, C., Maiolino, R., Sturm, E., et al. 2014, A&A, 562, A21 [NASA ADS] [CrossRef] [EDP Sciences] [Google Scholar]
- Crowther, P. A. 2000, A&A, 356, 191 [NASA ADS] [Google Scholar]
- Crowther, P. A. 2007, ARA&A, 45, 177 [Google Scholar]
- Crowther, P. A., Rate, G., & Bestenlehner, J. M. 2023, MNRAS, 521, 585 [NASA ADS] [CrossRef] [Google Scholar]
- Cullen, F., Shapley, A. E., McLure, R. J., et al. 2021, MNRAS, 505, 903 [CrossRef] [Google Scholar]
- Curti, M., Cresci, G., Mannucci, F., et al. 2017, MNRAS, 465, 1384 [Google Scholar]
- Curti, M., D’Eugenio, F., Carniani, S., et al. 2023, MNRAS, 518, 425 [Google Scholar]
- Curti, M., Witstok, J., Jakobsen, P., et al. 2025, A&A, 697, A89 [Google Scholar]
- Davidson, K., & Humphreys, R. M. 2012, Nature, 486, E1 [Google Scholar]
- De Cia, A., Ledoux, C., Fox, A. J., et al. 2012, A&A, 545, A64 [NASA ADS] [CrossRef] [EDP Sciences] [Google Scholar]
- De Cia, A., Ledoux, C., Mattsson, L., et al. 2016, A&A, 596, A97 [NASA ADS] [CrossRef] [EDP Sciences] [Google Scholar]
- Dunlop, J. S., Abraham, R. G., Ashby, M. L. N., et al. 2021, PRIMER: Public Release IMaging for Extragalactic Research, JWST Proposal. Cycle 1 [Google Scholar]
- Eldridge, J. J., & Stanway, E. R. 2009, MNRAS, 400, 1019 [NASA ADS] [CrossRef] [Google Scholar]
- Eldridge, J. J., & Vink, J. S. 2006, A&A, 452, 295 [NASA ADS] [CrossRef] [EDP Sciences] [Google Scholar]
- Eldridge, J. J., Stanway, E. R., Xiao, L., et al. 2017, PASA, 34, e058 [Google Scholar]
- Erb, D. K., Steidel, C. C., Shapley, A. E., et al. 2006, ApJ, 647, 128 [NASA ADS] [CrossRef] [Google Scholar]
- Fiore, F., Feruglio, C., Shankar, F., et al. 2017, A&A, 601, A143 [NASA ADS] [CrossRef] [EDP Sciences] [Google Scholar]
- Foreman-Mackey, D., Hogg, D. W., Lang, D., & Goodman, J. 2013, PASP, 125, 306 [Google Scholar]
- Förster Schreiber, N. M., Übler, H., Davies, R. L., et al. 2019, ApJ, 875, 21 [Google Scholar]
- Genzel, R., Newman, S., Jones, T., et al. 2011, ApJ, 733, 101 [Google Scholar]
- Gordon, K. D., Clayton, G. C., Misselt, K. A., Landolt, A. U., & Wolff, M. J. 2003, ApJ, 594, 279 [NASA ADS] [CrossRef] [Google Scholar]
- Götberg, Y., de Mink, S. E., & Groh, J. H. 2017, A&A, 608, A11 [NASA ADS] [CrossRef] [EDP Sciences] [Google Scholar]
- Grandi, S. A. 1980, ApJ, 238, 10 [NASA ADS] [CrossRef] [Google Scholar]
- Greene, J. E., & Ho, L. C. 2005, ApJ, 630, 122 [NASA ADS] [CrossRef] [Google Scholar]
- Greene, J. E., & Ho, L. C. 2007, ApJ, 667, 131 [NASA ADS] [CrossRef] [Google Scholar]
- Gunawardhana, M. L. P., Brinchmann, J., Croom, S., et al. 2025, MNRAS, 543, 3172 [Google Scholar]
- Hainich, R., Rühling, U., Todt, H., et al. 2014, A&A, 565, A27 [NASA ADS] [CrossRef] [EDP Sciences] [Google Scholar]
- Hillier, D. J., & Miller, D. L. 1999, ApJ, 519, 354 [Google Scholar]
- Hsyu, T., Cooke, R. J., Prochaska, J. X., & Bolte, M. 2020, ApJ, 896, 77 [NASA ADS] [CrossRef] [Google Scholar]
- Iben, I., & Tutukov, A. V. 1984, ApJS, 54, 335 [NASA ADS] [CrossRef] [Google Scholar]
- Imasheva, L., Janka, H.-T., & Weiss, A. 2023, MNRAS, 518, 1818 [Google Scholar]
- Isobe, Y., Ouchi, M., Tominaga, N., et al. 2023, ApJ, 959, 100 [NASA ADS] [CrossRef] [Google Scholar]
- Izotov, Y. I., Stasińska, G., Meynet, G., Guseva, N. G., & Thuan, T. X. 2006, A&A, 448, 955 [CrossRef] [EDP Sciences] [Google Scholar]
- Izotov, Y. I., Thuan, T. X., & Guseva, N. G. 2017, MNRAS, 471, 548 [NASA ADS] [CrossRef] [Google Scholar]
- Izotov, Y. I., Thuan, T. X., Guseva, N. G., & Liss, S. E. 2018, MNRAS, 473, 1956 [NASA ADS] [CrossRef] [Google Scholar]
- Izotov, Y. I., Thuan, T. X., & Guseva, N. G. 2021, MNRAS, 504, 3996 [NASA ADS] [CrossRef] [Google Scholar]
- Jenkins, E. B. 2009, ApJ, 700, 1299 [Google Scholar]
- Ji, X., Übler, H., Maiolino, R., et al. 2024, MNRAS, 535, 881 [NASA ADS] [CrossRef] [Google Scholar]
- Johansson, S., & Letokhov, V. S. 2004, A&A, 428, 497 [NASA ADS] [CrossRef] [EDP Sciences] [Google Scholar]
- Johansson, S., & Letokhov, V. S. 2005, MNRAS, 364, 731 [NASA ADS] [Google Scholar]
- Jones, A. P., Tielens, A. G. G. M., & Hollenbach, D. J. 1996, ApJ, 469, 740 [Google Scholar]
- Kashino, D., Silverman, J. D., Sanders, D., et al. 2019, ApJS, 241, 10 [Google Scholar]
- Kashino, D., Lilly, S. J., Renzini, A., et al. 2022, ApJ, 925, 82 [NASA ADS] [CrossRef] [Google Scholar]
- Kennicutt, R. C., & Evans, N. J. 2012, ARA&A, 50, 531 [NASA ADS] [CrossRef] [Google Scholar]
- Kobayashi, C., Karakas, A. I., & Lugaro, M. 2020, ApJ, 900, 179 [Google Scholar]
- Kobulnicky, H. A., & Skillman, E. D. 1997, ApJ, 489, 636 [NASA ADS] [CrossRef] [Google Scholar]
- Kobulnicky, H. A., Skillman, E. D., Roy, J.-R., Walsh, J. R., & Rosa, M. R. 1997, ApJ, 477, 679 [NASA ADS] [CrossRef] [Google Scholar]
- Kojima, T., Ouchi, M., Rauch, M., et al. 2021, ApJ, 913, 22 [NASA ADS] [CrossRef] [Google Scholar]
- Laseter, I. H., Maseda, M. V., Curti, M., et al. 2024, A&A, 681, A70 [NASA ADS] [CrossRef] [EDP Sciences] [Google Scholar]
- López-Sánchez, Á. R., & Esteban, C. 2010, A&A, 517, A85 [NASA ADS] [CrossRef] [EDP Sciences] [Google Scholar]
- López-Sánchez, Á. R., Esteban, C., García-Rojas, J., Peimbert, M., & Rodríguez, M. 2007, ApJ, 656, 168 [CrossRef] [Google Scholar]
- López-Sánchez, Á. R., Koribalski, B. S., van Eymeren, J., et al. 2012, MNRAS, 419, 1051 [CrossRef] [Google Scholar]
- Maeder, A., Przybilla, N., Nieva, M.-F., et al. 2014, A&A, 565, A39 [NASA ADS] [CrossRef] [EDP Sciences] [Google Scholar]
- Maiolino, R., Nagao, T., Grazian, A., et al. 2008, A&A, 488, 463 [NASA ADS] [CrossRef] [EDP Sciences] [Google Scholar]
- Mannucci, F., Cresci, G., Maiolino, R., et al. 2009, MNRAS, 398, 1915 [Google Scholar]
- Maoz, D., & Graur, O. 2017, ApJ, 848, 25 [Google Scholar]
- Marasco, A., Belfiore, F., Cresci, G., et al. 2023, A&A, 670, A92 [NASA ADS] [CrossRef] [EDP Sciences] [Google Scholar]
- Martins, F., & Palacios, A. 2022, A&A, 659, A163 [NASA ADS] [CrossRef] [EDP Sciences] [Google Scholar]
- Martins, F., Schaerer, D., Marques-Chaves, R., & Upadhyaya, A. 2023, A&A, 678, A159 [NASA ADS] [CrossRef] [EDP Sciences] [Google Scholar]
- Matsuoka, Y., Oyabu, S., Tsuzuki, Y., & Kawara, K. 2007, ApJ, 663, 781 [NASA ADS] [CrossRef] [Google Scholar]
- Méndez-Delgado, J. E., Esteban, C., García-Rojas, J., Kreckel, K., & Peimbert, M. 2023, Nature, 618, 249 [CrossRef] [Google Scholar]
- Méndez-Delgado, J. E., Kreckel, K., Esteban, C., et al. 2024, A&A, 690, A248 [NASA ADS] [CrossRef] [EDP Sciences] [Google Scholar]
- Méndez-Delgado, J. E., Skillman, E. D., Aver, E., et al. 2025, ApJ, 986, 74 [Google Scholar]
- Mesa-Delgado, A., Esteban, C., García-Rojas, J., et al. 2009, MNRAS, 395, 855 [NASA ADS] [CrossRef] [Google Scholar]
- Meštrić, U., Vanzella, E., Upadhyaya, A., et al. 2023, A&A, 673, A50 [NASA ADS] [CrossRef] [EDP Sciences] [Google Scholar]
- Mollá, M., García-Vargas, M. L., & Bressan, A. 2009, MNRAS, 398, 451 [CrossRef] [Google Scholar]
- Muratov, A. L., Kereš, D., Faucher-Giguère, C.-A., et al. 2015, MNRAS, 454, 2691 [NASA ADS] [CrossRef] [Google Scholar]
- Naiman, J. P., Pillepich, A., Springel, V., et al. 2018, MNRAS, 477, 1206 [Google Scholar]
- Nakajima, K., Ouchi, M., Isobe, Y., et al. 2023, ApJS, 269, 33 [NASA ADS] [CrossRef] [Google Scholar]
- Nelemans, G., Toonen, S., & Bours, M. 2013, IAU Symp., 281, 225 [Google Scholar]
- Nelson, D., Pillepich, A., Springel, V., et al. 2019, MNRAS, 490, 3234 [Google Scholar]
- Nelson, D., Springel, V., Pillepich, A., et al. 2019, Comput. Astrophys. Cosmol., 6, 2 [Google Scholar]
- Netzer, H., & Penston, M. V. 1976, MNRAS, 174, 319 [Google Scholar]
- Nomoto, K., Tominaga, N., Umeda, H., Kobayashi, C., & Maeda, K. 2006, Nucl. Phys. A, 777, 424 [CrossRef] [Google Scholar]
- Nomoto, K., Kobayashi, C., & Tominaga, N. 2013, ARA&A, 51, 457 [CrossRef] [Google Scholar]
- Oliva, E. 1993, A&A, 276, 415 [Google Scholar]
- Olive, K. A., & Skillman, E. D. 2004, ApJ, 617, 29 [NASA ADS] [CrossRef] [Google Scholar]
- Palay, E., Nahar, S. N., Pradhan, A. K., & Eissner, W. 2012, MNRAS, 423, L35 [NASA ADS] [CrossRef] [Google Scholar]
- Pascale, M., Dai, L., McKee, C. F., & Tsang, B. T. H. 2023, ApJ, 957, 77 [NASA ADS] [CrossRef] [Google Scholar]
- Patrício, V., Christensen, L., Rhodin, H., Cañameras, R., & Lara-López, M. A. 2018, MNRAS, 481, 3520 [CrossRef] [Google Scholar]
- Pettini, M., & Pagel, B. E. J. 2004, MNRAS, 348, L59 [NASA ADS] [CrossRef] [Google Scholar]
- Pettini, M., Shapley, A. E., Steidel, C. C., et al. 2001, ApJ, 554, 981 [NASA ADS] [CrossRef] [Google Scholar]
- Pillepich, A., Springel, V., Nelson, D., et al. 2018, MNRAS, 473, 4077 [Google Scholar]
- Planck Collaboration, V. I. 2020, A&A, 641, A6 [NASA ADS] [CrossRef] [EDP Sciences] [Google Scholar]
- Porter, R. L., Ferland, G. J., Storey, P. J., & Detisch, M. J. 2013, MNRAS, 433, L89 [NASA ADS] [CrossRef] [Google Scholar]
- Reddy, N. A., Shapley, A. E., Sanders, R. L., et al. 2025, ArXiv e-prints [arXiv:2506.17396] [Google Scholar]
- Reines, A. E., Greene, J. E., & Geha, M. 2013, ApJ, 775, 116 [Google Scholar]
- Rivera-Thorsen, T. E., Chisholm, J., Welch, B., et al. 2024, A&A, 690, A269 [NASA ADS] [CrossRef] [EDP Sciences] [Google Scholar]
- Rivero González, J. G., Puls, J., & Najarro, F. 2011, A&A, 536, A58 [NASA ADS] [CrossRef] [EDP Sciences] [Google Scholar]
- Rodríguez, M., & Rubin, R. H. 2005, ApJ, 626, 900 [CrossRef] [Google Scholar]
- Rodríguez, Ó., Maoz, D., & Nakar, E. 2023, ApJ, 955, 71 [CrossRef] [Google Scholar]
- Rodríguez-Ardila, A., Pastoriza, M. G., Viegas, S., Sigut, T. A. A., & Pradhan, A. K. 2004, A&A, 425, 457 [NASA ADS] [CrossRef] [EDP Sciences] [Google Scholar]
- Rogers, N. S. J., Strom, A. L., Rudie, G. C., et al. 2024, ApJ, 964, L12 [Google Scholar]
- Roman-Duval, J., Jenkins, E. B., Tchernyshyov, K., et al. 2022, ApJ, 928, 90 [NASA ADS] [CrossRef] [Google Scholar]
- Rudy, R. J., Rossano, G. S., & Puetter, R. C. 1989, ApJ, 342, 235 [Google Scholar]
- Rudy, R. J., Erwin, P., Rossano, G. S., & Puetter, R. C. 1992, ApJ, 384, 536 [Google Scholar]
- Rupke, D. S., Veilleux, S., & Sanders, D. B. 2005, ApJ, 632, 751 [NASA ADS] [CrossRef] [Google Scholar]
- Sabhahit, G. N., Vink, J. S., Sander, A. A. C., & Higgins, E. R. 2023, MNRAS, 524, 1529 [NASA ADS] [CrossRef] [Google Scholar]
- Sander, A., Hamann, W. R., & Todt, H. 2012, A&A, 540, A144 [NASA ADS] [CrossRef] [EDP Sciences] [Google Scholar]
- Sanders, R. L., Shapley, A. E., Kriek, M., et al. 2015, ApJ, 799, 138 [NASA ADS] [CrossRef] [Google Scholar]
- Sanders, R. L., Shapley, A. E., Kriek, M., et al. 2016, ApJ, 825, L23 [NASA ADS] [CrossRef] [Google Scholar]
- Sanders, R. L., Shapley, A. E., Topping, M. W., Reddy, N. A., & Brammer, G. B. 2024, ApJ, 962, 24 [NASA ADS] [CrossRef] [Google Scholar]
- Sanders, R. L., Shapley, A. E., Topping, M. W., et al. 2025, ArXiv e-prints [arXiv:2508.10099] [Google Scholar]
- Sawada, R., & Suwa, Y. 2023, ApJ, submitted [arXiv:2301.03610] [Google Scholar]
- Schaye, J., Crain, R. A., Bower, R. G., et al. 2015, MNRAS, 446, 521 [Google Scholar]
- Scholte, D., Cullen, F., Carnall, A. C., et al. 2025, MNRAS, 540, 1800 [Google Scholar]
- Scholtz, J., Carniani, S., Parlanti, E., et al. 2025, ArXiv e-prints [arXiv:2510.01034] [Google Scholar]
- Schwarz, G. 1978, Ann. Stat., 6, 461 [Google Scholar]
- Shapley, A. E. 2011, ARA&A, 49, 525 [NASA ADS] [CrossRef] [Google Scholar]
- Shapley, A. E., Reddy, N. A., Kriek, M., et al. 2015, ApJ, 801, 88 [NASA ADS] [CrossRef] [Google Scholar]
- Shapley, A. E., Sanders, R. L., Topping, M. W., et al. 2025, ApJ, 980, 242 [Google Scholar]
- Sommariva, V., Mannucci, F., Cresci, G., et al. 2012, A&A, 539, A136 [NASA ADS] [CrossRef] [EDP Sciences] [Google Scholar]
- Stanton, T. M., Cullen, F., Carnall, A. C., et al. 2025, MNRAS, 537, 1735 [Google Scholar]
- Stanway, E. R., & Eldridge, J. J. 2018, MNRAS, 479, 75 [NASA ADS] [CrossRef] [Google Scholar]
- Steidel, C. C., Adelberger, K. L., Shapley, A. E., et al. 2003, ApJ, 592, 728 [Google Scholar]
- Steidel, C. C., Rudie, G. C., Strom, A. L., et al. 2014, ApJ, 795, 165 [Google Scholar]
- Steidel, C. C., Strom, A. L., Pettini, M., et al. 2016, ApJ, 826, 159 [NASA ADS] [CrossRef] [Google Scholar]
- Stern, J., & Laor, A. 2012, MNRAS, 423, 600 [NASA ADS] [CrossRef] [Google Scholar]
- Strickland, D. K., & Heckman, T. M. 2009, ApJ, 697, 2030 [Google Scholar]
- Strom, A. L., Steidel, C. C., Rudie, G. C., Trainor, R. F., & Pettini, M. 2018, ApJ, 868, 117 [NASA ADS] [CrossRef] [Google Scholar]
- Strom, A. L., Rudie, G. C., Trainor, R. F., et al. 2023, ApJ, 958, L11 [NASA ADS] [CrossRef] [Google Scholar]
- Tominaga, N., Umeda, H., & Nomoto, K. 2007, ApJ, 660, 516 [NASA ADS] [CrossRef] [Google Scholar]
- Topping, M. W., Shapley, A. E., Reddy, N. A., et al. 2020, ArXiv e-prints [arXiv:2008.02282] [Google Scholar]
- Topping, M. W., Shapley, A. E., Reddy, N. A., et al. 2020, MNRAS, 495, 4430 [Google Scholar]
- Topping, M. W., Stark, D. P., Senchyna, P., et al. 2024, MNRAS, 529, 3301 [NASA ADS] [CrossRef] [Google Scholar]
- Tramper, F., Straal, S. M., Sanyal, D., et al. 2015, A&A, 581, A110 [NASA ADS] [CrossRef] [EDP Sciences] [Google Scholar]
- Tumlinson, J., Peeples, M. S., & Werk, J. K. 2017, ARA&A, 55, 389 [Google Scholar]
- Vale Asari, N., Stasińska, G., Morisset, C., & Cid Fernandes, R. 2016, MNRAS, 460, 1739 [NASA ADS] [CrossRef] [Google Scholar]
- Vink, J. S. 2025, IAU Symp., 19, 106 [Google Scholar]
- Vink, J. S., & Gräfener, G. 2012, ApJ, 751, L34 [Google Scholar]
- Vink, J. S., Muijres, L. E., Anthonisse, B., et al. 2011, A&A, 531, A132 [NASA ADS] [CrossRef] [EDP Sciences] [Google Scholar]
- Waxman, E., & Draine, B. T. 2000, ApJ, 537, 796 [NASA ADS] [CrossRef] [Google Scholar]
- Webbink, R. F. 1984, ApJ, 277, 355 [NASA ADS] [CrossRef] [Google Scholar]
- Welch, B., Rivera-Thorsen, T. E., Rigby, J. R., et al. 2025, ApJ, 980, 33 [Google Scholar]
- Woosley, S. E., & Heger, A. 2007, Phys. Rep., 442, 269 [Google Scholar]
Pa8 and Pa9 lines, while formally covered by the extended G235M/F170LP grating, fall within the MSA detector gap.
Which is de-blended from the [Ne III]λ3968 emission by assuming a fixed [Ne III]λ3968/[Ne III]λ3869 = 0.31 line ratio.
Taken as the sum of the [O II]λ7320,7330 doublet.
Here we consider the abundance values derived under the assumption of no temperature fluctuations (t2 = 0) for consistency with our fiducial measurements in M4327.
Where we have conservatively applied a further relative 20% uncertainty on the dust depletion correction factor.
We note that different choices of [α/Fe] do not significantly impact the shape of the WR bumps, which are primarily sensitive to the total stellar metallicity and age of the burst.
The time at which SN Ia start to contribute to the chemical enrichment of the ISM.
This is generally consistent with double-degenerate SN Ia progenitor scenarios involving two merging white dwarfs (e.g., Iben & Tutukov 1984; Webbink 1984).
We note, however, that adopting, e.g., ne = 380 cm−3 as in Förster Schreiber et al. (2019) would lower all quoted Ṁout and η by a factor ≃1.9; similarly, choosing a larger effective radius would reduce them proportionally.
The frequency difference is roughly one thermal Doppler width of Lyβ at temperatures T ∼ 104 K.
If the Hα optical depth is large enough such that the H I 3p level is not rapidly depopulated.
As the decay of the lower 3s 3S1 level to the ground level is faster than the decay of the upper 3p 3P level, population inversion can occur, which, under specific conditions, can produce stimulated emission and a laser effect (e.g., Johansson & Letokhov 2005).
We also note that temperature has a competing effect here in the modeling of Balmer line ratios as, on the one hand, lower temperatures implies a higher intrinsic Hα/Hβ (for the Case B) at fixed AV (and vice versa), whereas on the other hand to boost the predicted Hα/Hβ ratio via collisional excitation one needs to substantially increase Te at fixed AV and ξ.
We note that because of degeneracies among templates, Of/WN could possibly be absorbing some early-WN contribution, hence we warn against any straightforward physical interpretation of the inferred number of templates for each stellar type
Appendix A: Comparing synthetic to in-slit photometry
As discussed in Sect. 2, and more extensively in Cataldi et al. (2025), at the data processing stage MARTA galaxies are corrected for path-losses assuming a point-like source shape. Although in many cases such an assumption works well for (clumpy) high-z systems than assuming a uniformly illuminated slit, galaxies at Cosmic Noon often show extended and resolved morphologies, and deviations from the point-like correction curve can impact the measured emission line ratios, especially for lines widely spaced in wavelength. At the same time, to correct the extracted spectrum to match the full galaxy photometry, including regions not probed by the NIRSpec slit and possibly characterized by different color gradients, might introduce unknown systematics in the analysis. Therefore, we have tested the consistency between the flux calibrated NIRSpec spectrum of M4327 in both G140M/F100LP and G235M/F170LP gratings/filters and the photometry extracted from the region of the galaxy that is ‘sampled’ by the same area of the slit from which the spectrum is extracted, i.e., in our case the central shutter.
We computed the synthetic photometry from the spectrum by applying the bandpass of NIRCAM F115W, F150W, F200W, and F277W filters, i.e., the available broadband filters from the PRIMER programme (Dunlop et al. 2021) that overlaps with our NIRSpec grating/filter configurations. To extract the ‘in-slit’ photometry instead, we first generated a segmentation map from each NIRCAM image, and identified the overlapping area between the segmentation maps and the overlaid central shutter of the NIRSpec slit, at sub-pixel precision. We then extracted the photometry for each filter weighting each image pixel by the fraction of its area that is intercepted by the central NIRSpec shutter.
The comparison between the reduced NIRSpec spectrum of M4327 (as delivered by the pipeline with point-source path-losses corrections), the derived synthetic photometry, and the in-slit photometry extracted from F115W, F150W, F200W, and F277W images is shown in Figure A.1. The two measurements appear in good agreement, and only a minor correction to the extracted 1D spectrum is required to match the synthetic to the in-slit photometric points, with a small wavelength dependence. For this purpose, we derived the correction as a function of wavelength by interpolating the ratio between the two photometric measurements at the four available pivot wavelengths across the full wavelength array, which we then apply to the 1D NIRSpec spectrum.
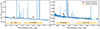 |
Fig. A.1. Comparison between synthetic and apodized (in-slit) photometry. The synthetic photometry is obtained from the NIRSpec spectrum of M4327 as delivered by the data reduction pipeline (with point-source-like path-losses correction) by integrating over the NIRCam F115W, F150W, F200W, and F277W bandpasses. The apodized photometry is instead measured from the area of the NIRCam images in the same filters that overlaps with the central shutter of the NIRSpec slitlet (i.e., the region from where the 1D spectrum is extracted). |
Appendix B: More details on the derivation of physical parameters
B.1. Temperature, density, and AV
Here, we show the results of the MCMC analysis described in Sect. 4.2. Fig. B.1 reports the marginalized posterior probability distribution function (PDF) for our parameters, and we mark the median values (taken as fiducial estimates) together with the 16th-84th percentiles (taken as formal uncertainties) of each distribution.
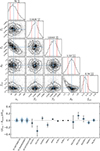 |
Fig. B.1. Results of the MCMC sampling analysis for the derivation of Te, ne, and AV. The top panel reports the corner plots with 2D and 1D marginalized posterior distributions for the free parameters in our model, namely ne, T2, T3, AV, and fcov. The PDF medians, 16th, and 84th percentiles are marked. In the bottom panel, we compare the observed to modeled line ratios. Black points with errorbars represent observed values, whereas blue violin plots show the full posterior distribution for each line ratio as sampled from the MCMC chain. |
In the bottom panel of the same Figure, we compare the observed and predicted line ratios, the latter modeled based on the fiducial values inferred for the set of parameters explored by the MCMC analysis. Black points and errorbars mark observed values and their uncertainties, whereas the blue shaded areas span the range of values explored for each line ratio by the MCMC sampler. Most line ratios are reproduced with excellent accuracy and within their 1σ uncertainty, with more significant deviations only for Hδ, H9, H11, and Pa11.
B.2. Metal abundances
Here we report the final corner plots and marginalized posterior distributions for elemental abundances derived as described in Sect. 4.3: these are shown in Fig. B.2.
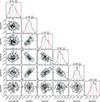 |
Fig. B.2. Corner plots and marginalized PDF for different relative gas-phase elemental abundances of metal ions, as obtained by post-processing the full MCMC chain generated in the derivation of Te, ne, and AV as discussed in Sect. 4.3. The medians, 16th, and 84th percentiles of the marginalized PDFs are marked. |
B.3. Helium abundance
In Sect. 4.3.2 we have described the approach followed to measure the helium abundance in M4327. Here, we provide more details on the implemented emission line modeling of Eq. (3). To account for the contribution of collisional excitation to the emissivity of the hydrogen and helium lines, we followed the methodology outlined in Aver et al. (2010) and implemented as in Hsyu et al. (2020), Aver et al. (2021) (see, e.g., equation B.5 of the latter), where the collisional-to-recombination correction factor  is derived as a function of the collisional transition rate from the ground state to the level i above the level of interest j (with transition from j → 2 emitted at wavelength λ), the various possible branching paths for transitioning to j and their relative fraction BRi → j, and the ratio between the (residual) neutral and ionized hydrogen densities ξ = n(HI)/n(HII). Ultimately,
  is expressed as a function of ξ and electron temperature as
 (B.1)
(B.1)
where T4 is the temperature in units of 104 K and the coefficients ai, bi, ci for the different hydrogen lines are taken from Table 8 of Aver et al. (2021), noting that the contribution of collisional excitation to helium lines emissivity is already included in our assumed set of atomic parameters from Porter et al. (2013). We also note that, for small residual fractions of neutral hydrogen as typical in H II regions (ξ ≈ 10−4), the relative contribution to hydrogen emissivity is predicted to be low, being e.g. larger than 1% for Hα only at temperatures T ≳ 18, 000 K (see e.g. Figure 2 in Hsyu et al. 2020). Therefore, we do not expect such a contribution to be highly relevant in our case study14. The optical depth correction term f(ne, T, τ), normalised to the value at He Iλ3889, is instead modeled as
![Mathematical equation: $$ \begin{aligned} f_{\lambda }(n_{e}, T, \tau ) = 1 + \frac{\tau }{2} \, [a + (b_0 + b_1 n_{e} + b_2 n_{e}^{2}) \, (T/10^4\,K)] \end{aligned} $$](/articles/aa/full_html/2026/06/aa58145-25/aa58145-25-eq45.gif) (B.2)
(B.2)
with coefficients taken from Olive & Skillman (2004).
Beyond Te, ne, AV, and fcov, the free parameters in our model are therefore y+ and τ, for which we impose uniform priors within 0.05 < y+ < 0.15 and 0 < τ < 10, respectively, and ξ, for which we assume a Gaussian prior centered on log(ξ) = −4 and with σ = 0.5 to prevent the exploration of regions of the parameter space non compatible with the typical ionization conditions of HII regions (e.g. with residual neutral fractions much higher than 1%). To model the temperature of the helium emitting zone, we impose a weak Gaussian prior centered on the independent measurement available from the [O III]λ4363/5007 ratio, and assuming a conservative 20% uncertainty (e.g. Aver et al. 2011). For the electron density instead, we leave ne free to vary to exploit the sensitivity of the HeIλ10832 to such parameter, with no imposed priors based on the sulfur doublet line ratio (see e.g. Berg et al. 2026, for a discussion on the effects of imposing such a prior in the He abundance derivation). The corner plots resulting from our MCMC run are displayed in Figure B.3, whereas the results are discussed in Sect. 4.3.2 of the main text.
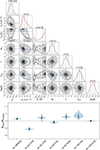 |
Fig. B.3. Results of the MCMC run for He abundance derivation (y+). Top panel: Corner plots and marginalized PDF for the parameters in our model. Compared to the framework adopted in Sect. 4.2, here we included corrections for the optical depth τ and for the collisional excitation of hydrogen and helium lines (expressed as a function of temperature and the residual fraction of neutral hydrogen ξ) as additional terms, as discussed in the text of Appendix B. Bottom panel: Comparison between modeled and observed He-to-Hβ line ratios included in our fit. |
Aside helium abundance derivation, we note that in the M4327 spectrum we have access to helium line ratios sensitive to electron temperature, i.e., He I λ7281/6678 and λ7281/5876, providing complementary information to auroral lines of metals. Following Méndez-Delgado et al. (2025), we interpolated over a fine (10 K) grid of temperature versus emissivity computed with the PYNEB.GETEMISSIVITY routine, and compared predictions with observed line ratios to infer the temperature values. We measure Te(He I λ7281/6678) = 9828 ± 4118 K, and Te(He I λ7281/5876) = 10002 ± 4619 K, and we take the average Te(He I) = 9914 ± 3073 K as our fiducial estimate. This value is consistent (within the uncertainties) with that derived from the auroral lines of oxygen, suggesting no significant (or only minor) temperature fluctuations nor strong deviations from Case B recombination, at least in the region probed by (highly) ionized gas (but see the discussion in Méndez-Delgado et al. 2025, where discrepancies between the two temperatures are observed in large samples of nearby star-forming galaxies and planetary nebulae).
Appendix C: Alternative fits to the blue and red bumps
As discussed in Sect. 5.1.1, we attempted to fit the spectral regions hosting the blue and red bumps by complementing WN templates with a combination of templates of transition WR stars, namely OfWN, WNE/C, and WNE/L, as well as stars of the oxygen sequence (WO). In Fig. C.1 we plot the results of this fitting exercise.
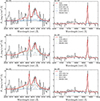 |
Fig. C.1. Alternative fits to the blue and red bump in M4327. The best-fit models to the combined spectral regions hosting the blue and red bumps are built from a combination of LMC empirical templates from Crowther et al. (2023). While all models contain WN stars, each row differs for the set of complementary templates adopted, namely Of/WN, WNE/C and WNE/L, and WO for the upper, middle, and bottom panels, respectively. |
We find that a combination of Of/WN (hydrogen-rich) and early-type WN templates (WN2-5 and WN3-7) produces a match to the blue bump as good as that delivered by our fiducial combination of early- and late-type WN stars, whereas WNE/C and WNE/L types provide results similar to including WC templates only. Despite the very large number (∼85, 000) of Of/WN templates required, we argue that such a scenario might not be completely un-physical when analyzing integrated spectra of z ∼ 2 galaxies experiencing young bursts of star-formation at sub-solar metallicity15.
Finally, we tried to include WR stars of the oxygen sequence (WO) in the fit. These stars are thought to represent the very final stages of the evolution of massive stars (≈45 − 60 M⊙) after the WC phase, but differ from the latter by means of a prominent, broad O VI λ emission at 3811-34 Å which reflects the high oxygen abundance expected near the end of core-helium burning and high stellar temperatures (Sander et al. 2012; Tramper et al. 2015); alternative explanations invoke higher excitation conditions without necessarily requiring an enhanced oxygen abundance (Hillier & Miller 1999; Aadland et al. 2022). Interestingly, WO templates are the only ones in the set producing a contribution to the ≈ 5760 Å red bump feature without significantly over-predicting the C IV features at ≈ 5810 Å; at the same time, their contribution to the blue bump is not dissimilar to that of WC4-5 stars. However, given their very short-lived phase, which makes them extremely rare (in the LMC there are only 3 WO stars currently known), and the absence of any evident O IV λ3811,34 Å emission in the M4327 spectrum, we consider the number of 64317 WO stars as inferred in this scenario largely implausible, even when accounting for resolution effects and possible strong degeneracies among the different templates that can cause significant overfitting.
Appendix D: An intermediate-mass black hole?
Here, we discuss an alternative scenario to explain the observed broad Hα component, pointing toward the possible presence of a small, vigorously accreting black hole. Under such a scenario, we assume that the broad Hα emission arises from the broad–line region (BLR), and we applied the single–epoch virial method of Reines et al. (2013) to derive the black-hole mass:
 (D.1)
(D.1)
where LHα is the dust–corrected broad Hα luminosity and FWHMHα is the intrinsic FWHM of the broad Hα component, corrected for instrumental resolution. With LHα, br ≈ 2.31 × 1041 erg s−1 and FWHMHα, int = 425 km s−1, we obtain MBH ≈ 3 × 10⁵ M⊙. We then estimated the bolometric luminosity using the empirical scaling of Greene & Ho (2005, 2007), Stern & Laor (2012), Lbol ≈ 130 × LHα, br, which yields Lbol ≈ 3.0 × 1043 erg s−1. The corresponding Eddington luminosity is
 (D.2)
(D.2)
and thus the inferred Eddington ratio is 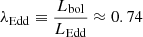 .
.
Such a vigorously accreting intermediate–mass black hole could, in principle, produce the observed broad component without dominating the narrow–line ISM diagnostics if the narrow–line region is weak, obscured, or strongly diluted by star-formation. Furthermore, it could represent a significant (if not the main) powering source of the OIλ8446 emission discussed in Sect. 5.4.
However, the modest FWHM (∼425 km s−1) and the lack of other strong AGN indicators still favor a stellar–feedback origin, and deeper multi-wavelength observations would be required to bring further evidence in favor of the faint-AGN scenario. Finally, we note that the BH mass hereby estimated for M4327 leverages calibration relations obtained from galaxy samples with typical FWHMHα > 1000 km s−1 and brighter luminosities (LHα > 1042 km s−1): therefore, the applicability of such BH mass calibrations to the case of MARTA-4327 is not well validated yet, due to the poor available statistics of intermediate-mass black holes.
All Tables
All Figures
|
Fig. 1. False color RGB image of M4327. The three-shutters long NIRSpec slitlet and the effective five-shutters locations spanned by the three-nodding pattern are overlaid. |
| In the text | |
|
Fig. 2. JWST/NIRSpec spectrum of MARTA-4327. Top panel: Combined G140M/F100LP (green) and G235M/F170LP (red) spectrum. The main emission lines detected are reported. Middle panels: Zoom-in onto the region of the auroral lines, i.e., [O III]λ4363 and [S II]λ4069 in G140M (left), [S III]λ6312 and [O IIλλ7320,7330 in G235M (right). The PPXF best-fit to the spectrum is overlaid in red (continuum in green, emission lines highlighted in yellow), while the 2D spectra and the fit residuals are shown in the upper and lower inset panels, respectively. Bottom panels: Zoom-in onto the region of high-order Balmer lines (left), and Paschen and O I λ8446 lines (right). |
| In the text | |
|
Fig. 3. Blue and red bump features in M4327. The plots show a zoom-in on the spectral region between 4550−4750 Å (left panel), and 5650−5950 Å (right panel), highlighting both stellar and nebular features. Features associated with the so-called blue and red bumps are marked in blue and red, respectively, with nebular line emission in black. The shaded regions highlight the spectral ranges adopted to derive the EW of the associated stellar features (as reported in Table 1), with the “extended red bump” region defined by the combined orange and red area. A single Gaussian fit to the broad He IIλ4686 emission is shown by the dashed line, while the fit to the nebular [Fe III]λ4658 and HeIλ5875 emission lines are marked by solid lines (and shaded in gray). |
| In the text | |
|
Fig. 4. Zoom-in on the Hα and [N II]λ6585 emission lines in the G235H/F170LP grating. The best-fit model is overlaid in red, with the Hα broad component highlighted in green. The inclusion of such a component significantly improves the fit, with a ΔBIC ≫ 10 compared to the one-component fit. The Hα broad component (FWHM = 445 km s−1) is blueshifted from the systemic redshift by ∼70 km s−1, possibly tracing outflowing gas in the galaxy. |
| In the text | |
|
Fig. 5. R versus wavelength for M4327. The logarithm of the ratio between observed and theoretical (Case B) line ratios of hydrogen lines to Hα, R, is plotted as a function of wavelength. Colored lines represent the R vs λ relationship predicted for different values of E(B − V), given the Cardelli et al. (1989) (solid lines, RV = 3.1) and Gordon et al. (2003) Small Magellanic Cloud (dashed lines, RV = 2.74) attenuation curves, respectively. The black curve reports the relationship obtained by performing a least-square fit to all available hydrogen lines ratios (for a Cardelli et al. 1989 law), whereas the purple curve represents the best-fit E(B − V)cov and fcov values obtained by adopting the dust-covering fraction model by Reddy et al. (2025). |
| In the text | |
|
Fig. 6. Relative gas-phase Fe, O, and N abundance patterns. The position of M4327 in the log(Fe/O) vs 12+log(O/H) (left panel) and log(Fe/N) vs 12+log(N/H) (right panel) diagrams is compared with the distribution of local star-forming nebulae from the DESIRED project Méndez-Delgado et al. (2024), star-forming galaxies hosting WR features (López-Sánchez & Esteban 2010), extremely metal-poor galaxies with signatures of WR activity (J1205+4551, Izotov et al. 2017; J0811+4730, Izotov et al. 2018; J1631+4426, Kojima et al. 2021), and with the Sunburst Arc at z ∼ 2.37 (Rivera-Thorsen et al. 2024). Notably, almost all galaxies with WR signatures are characterized by an Fe-enhancement in the gas-phase compared to the average trend of local nebulae. |
| In the text | |
|
Fig. 7. Comparison of blue and red bump features in M4327 with SSP models and empirical templates. Upper panels: M4327 spectrum is compared with a set of SSP models from BPASS v2.2.1 for different burst ages, assuming a stellar metallicity of 20% Z⊙, a Chabrier (2003) IMF, an alpha-enhancement [α/Fe] = 0.4, and including binary evolution. The broad He II feature, if assumed purely stellar in origin, is well reproduced by a t ∼ 6 Myr-old burst (solid line), although these models under-predict the strength of the blue nitrogen features at ≈4620 − 4640 Å. Middle and bottom panels: M4327 spectrum is fitted with a combination of empirical WR template spectra from Crowther et al. (2023). The best-fit model in the middle panels include only stars of the WN type, whereas in the bottom panels we have included also WC stars; nebular emission lines are fitted separately with individual Gaussian components. |
| In the text | |
|
Fig. 8. Comparison between the EWs of the blue and red bump features. Left panel: EW of the blue bump (specifically, the 4605−4650 Å complex) versus the EW of the red bump complex (measured between 5780−5850 Å). Right panel: EW[4605−4650 Å] versus EW(He IIλ4686). The circle points report similar measurements for a sample of local galaxies where the presence of VMS (purple) of WR stars (blue) has been identified (or suggested). Gray points mark systems with no signatures of WR or VMS, or galaxies with He IIλ4686 detection but no robust classification. Blue tracks are BPASS models for single bursts of star-formation of different ages (from 1 to 10 Myr), whereas dashed and dot-dashed red tracks are models including VMS contribution for single bursts and constant star-formation, respectively. Data and VMS models compiled from Martins et al. (2023) (see also references therein). |
| In the text | |
|
Fig. 9. Chemical abundance patterns. From left to right, we show the position of M4327 in the N/O vs. O/H, Ne/O vs. O/H, and O/Ar vs. Ar/H diagrams. A compilation of local galaxies and HII regions with Te-based abundance measurements from CHAOS (Berg et al. 2016), BOND (Vale Asari et al. 2016), and DESIRED (Méndez-Delgado et al. 2024) is shown for comparison, together with the sample of Wolf-Rayet galaxies from López-Sánchez & Esteban (2010). In the O/Ar vs. Ar/H diagram, we overplot the galactic chemical evolution tracks for the MW (solar neighborhood, orange) and the disc of M31 (between 3 and 14 kpc, purple) from Kobayashi et al. (2020) (see also, Arnaboldi et al. 2022). |
| In the text | |
|
Fig. 10. [O/Fe] versus sSFR relationship for galaxies. The location of M4327 is reported alongside a literature sample comprised of nearby dwarf galaxies, local galaxies with blue supergiant-based metallicity estimates, extremely metal-poor dwarf galaxies, and high-redshift star-forming galaxies/stacks, as presented in Chruślińska et al. (2024) (see the legend, and references therein). M4327 represents, together with the Sunburst Arc, the only high-z galaxy with Te-based determination of both gas-phase oxygen and Fe abundances (the latter corrected to total Fe/O abundance as detailed in Sect. 4.3.3). The hatched bar indicates the average abundance ratio of the MW thick disc and/or halo dwarf stars with [Fe/H] < −2 from Amarsi et al. (2019), whereas hatched symbols mark high-z galaxies with indirect determination of stellar metallicity (Fe/H) via modeling of optical lines. Shaded areas represent the model [O/Fe]–sSFR relation derived as detailed in Chruślińska et al. (2024) (see their Eq. 1) for different assumptions on the SN Ia delay-time distribution, namely a power-law DTD with slope equal to −1.1 with τIa, min = 400 Myr (blue) and 40 Myr (green); upper and/or lower curves of the same color correspond to different choices of the relative iron yield of SN Ia and CCSN, namely CIa/CC = 0.74 and 2.5, respectively. The brown, dashed line marks the same relationship as obtained in TNG100 simulations with fIa ∝ −1.12 and CIa/CC = 2.04. |
| In the text | |
|
Fig. A.1. Comparison between synthetic and apodized (in-slit) photometry. The synthetic photometry is obtained from the NIRSpec spectrum of M4327 as delivered by the data reduction pipeline (with point-source-like path-losses correction) by integrating over the NIRCam F115W, F150W, F200W, and F277W bandpasses. The apodized photometry is instead measured from the area of the NIRCam images in the same filters that overlaps with the central shutter of the NIRSpec slitlet (i.e., the region from where the 1D spectrum is extracted). |
| In the text | |
|
Fig. B.1. Results of the MCMC sampling analysis for the derivation of Te, ne, and AV. The top panel reports the corner plots with 2D and 1D marginalized posterior distributions for the free parameters in our model, namely ne, T2, T3, AV, and fcov. The PDF medians, 16th, and 84th percentiles are marked. In the bottom panel, we compare the observed to modeled line ratios. Black points with errorbars represent observed values, whereas blue violin plots show the full posterior distribution for each line ratio as sampled from the MCMC chain. |
| In the text | |
|
Fig. B.2. Corner plots and marginalized PDF for different relative gas-phase elemental abundances of metal ions, as obtained by post-processing the full MCMC chain generated in the derivation of Te, ne, and AV as discussed in Sect. 4.3. The medians, 16th, and 84th percentiles of the marginalized PDFs are marked. |
| In the text | |
|
Fig. B.3. Results of the MCMC run for He abundance derivation (y+). Top panel: Corner plots and marginalized PDF for the parameters in our model. Compared to the framework adopted in Sect. 4.2, here we included corrections for the optical depth τ and for the collisional excitation of hydrogen and helium lines (expressed as a function of temperature and the residual fraction of neutral hydrogen ξ) as additional terms, as discussed in the text of Appendix B. Bottom panel: Comparison between modeled and observed He-to-Hβ line ratios included in our fit. |
| In the text | |
|
Fig. C.1. Alternative fits to the blue and red bump in M4327. The best-fit models to the combined spectral regions hosting the blue and red bumps are built from a combination of LMC empirical templates from Crowther et al. (2023). While all models contain WN stars, each row differs for the set of complementary templates adopted, namely Of/WN, WNE/C and WNE/L, and WO for the upper, middle, and bottom panels, respectively. |
| In the text | |
Current usage metrics show cumulative count of Article Views (full-text article views including HTML views, PDF and ePub downloads, according to the available data) and Abstracts Views on Vision4Press platform.
Data correspond to usage on the plateform after 2015. The current usage metrics is available 48-96 hours after online publication and is updated daily on week days.
Initial download of the metrics may take a while.