


Fig. C.1.
Download original image
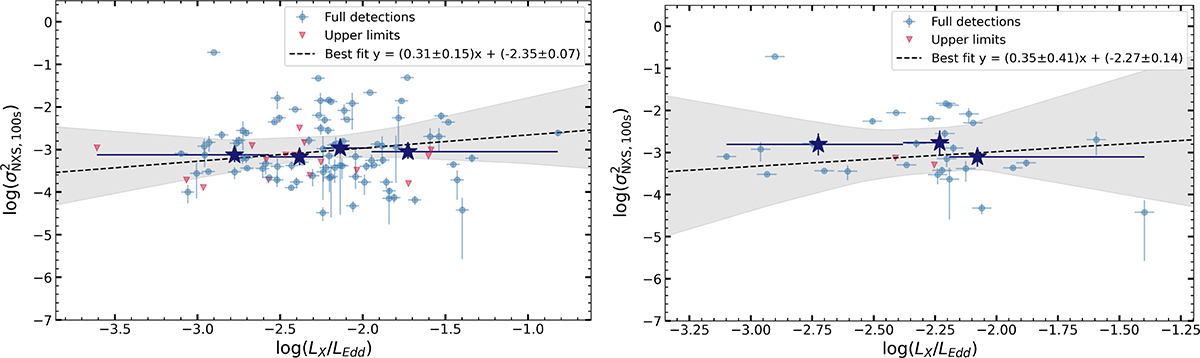
Relation between the X-ray excess variance and the X-ray Eddington ratio, λX ≡ L2 − 10 keV/LEdd. Left: Full sample. Right: RM-only subsample. Cyan points show detections; red triangles show upper limits. Dark-blue stars indicate medians in λX bins (shown for visualisation only). The dashed black lines show the best-fit relations; the grey shaded areas show the 1σ confidence intervals. Slopes and intercepts are indicated in each panel.
Current usage metrics show cumulative count of Article Views (full-text article views including HTML views, PDF and ePub downloads, according to the available data) and Abstracts Views on Vision4Press platform.
Data correspond to usage on the plateform after 2015. The current usage metrics is available 48-96 hours after online publication and is updated daily on week days.
Initial download of the metrics may take a while.