


Open Access
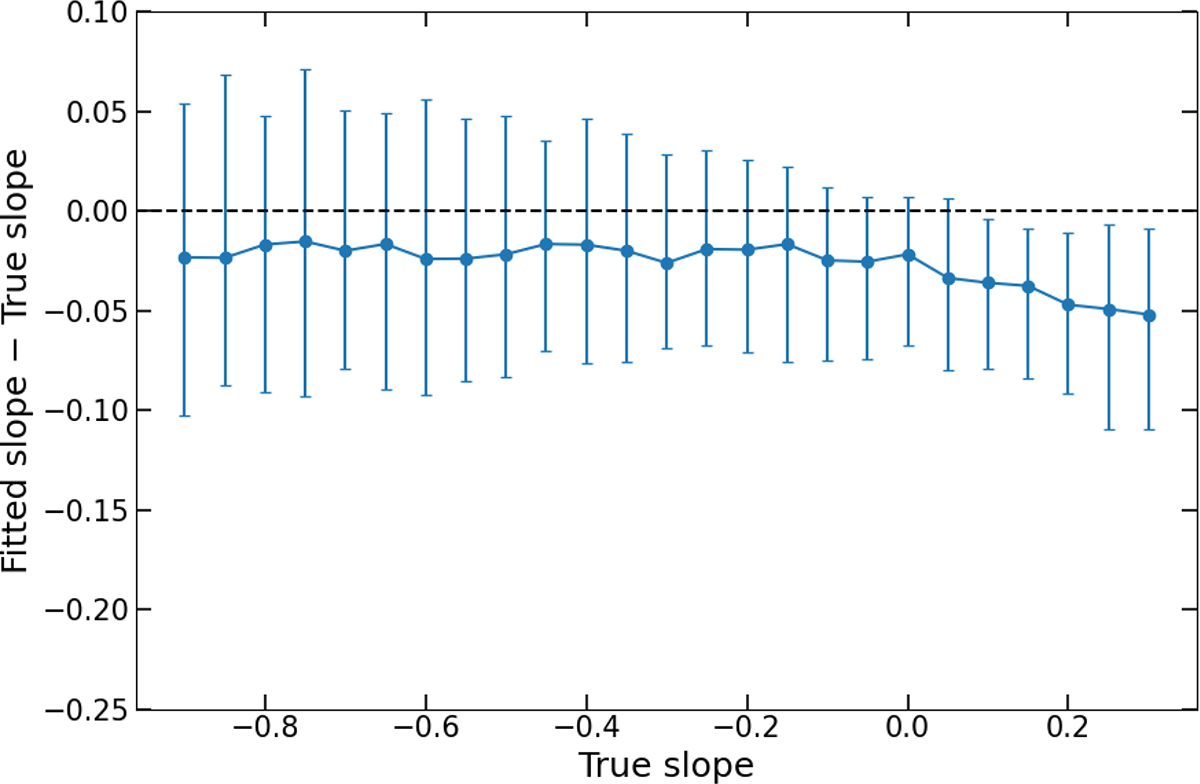
Fig. A.2.
Download original image
Difference between the true slope chosen to build the mock sample and the one recovered with the fit procedure, assuming 15% fraction of upper limits, and varying the value of the true slope. Each point shows the mean and standard deviation obtained from 250 mock samples created with a given slope.
Current usage metrics show cumulative count of Article Views (full-text article views including HTML views, PDF and ePub downloads, according to the available data) and Abstracts Views on Vision4Press platform.
Data correspond to usage on the plateform after 2015. The current usage metrics is available 48-96 hours after online publication and is updated daily on week days.
Initial download of the metrics may take a while.