


Fig. 5.
Download original image
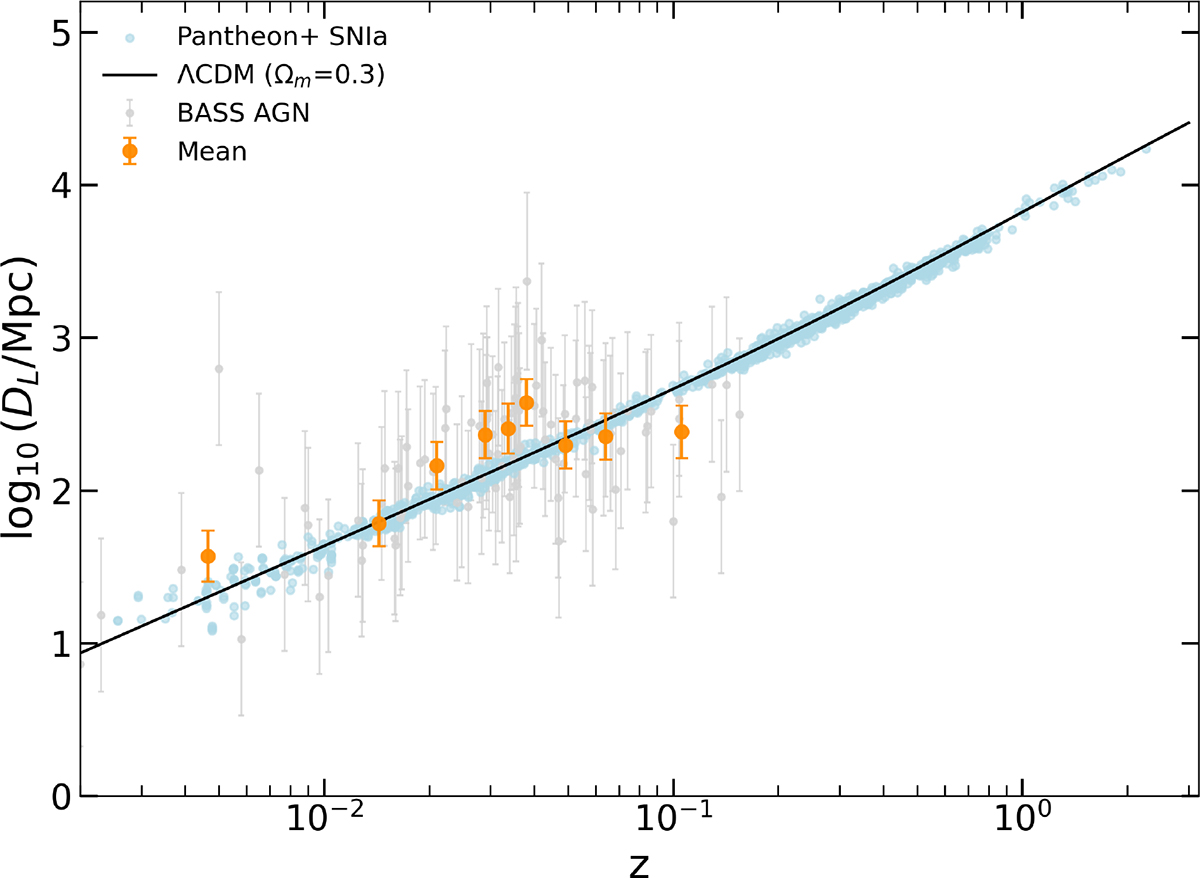
Proof-of-concept Hubble diagram for the BASS sample (grey points) using the relation between X-ray excess variance and the 2–10 keV luminosity. The dark orange points show the mean values obtained by binning the sample into nine equal-sized bins. Cyan points represent the Pantheon+ Supernovae Ia sample (Scolnic et al. 2018), while the black line represents the prediction from a standard flat ΛCDM model. The redshift range and limited statistics of the BASS sample currently undermine the cosmological implementation of the method, but future probes might open new possibilities (see Sect. 6).
Current usage metrics show cumulative count of Article Views (full-text article views including HTML views, PDF and ePub downloads, according to the available data) and Abstracts Views on Vision4Press platform.
Data correspond to usage on the plateform after 2015. The current usage metrics is available 48-96 hours after online publication and is updated daily on week days.
Initial download of the metrics may take a while.