


Fig. 4.
Download original image
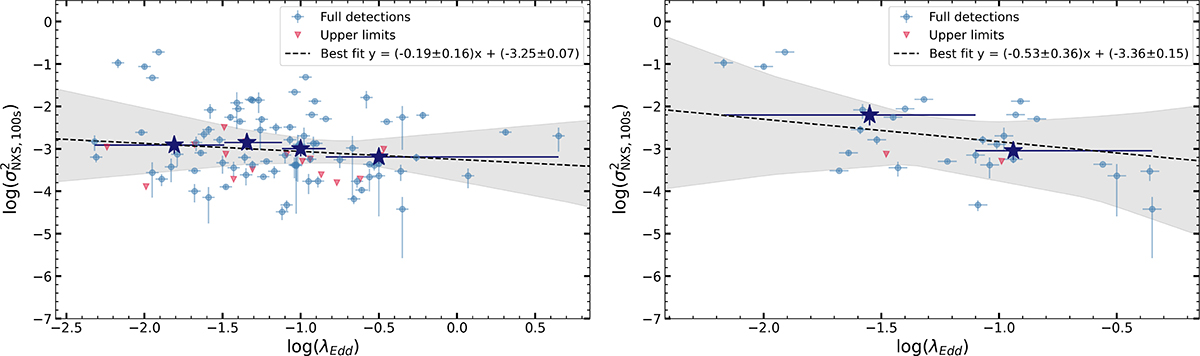
Relation between the X-ray excess variance σNXS and the λEdd. Blue stars represent averaged bins in the Eddington ratio and are shown to guide the eye. Left: Fit performed for the whole sample, where 102 objects out of 134 have black hole masses estimated using the virial equation and 32 have RM estimates. Despite the reduced fraction of upper limits and increased precision of the λEdd estimates compared with other studies, there is still no significant relation between X-ray variability and the λEdd. Right: Same analysis for the subsample of objects with black hole masses derived from RM (N = 32). There is an anti-correlation, but it is only slightly significant.
Current usage metrics show cumulative count of Article Views (full-text article views including HTML views, PDF and ePub downloads, according to the available data) and Abstracts Views on Vision4Press platform.
Data correspond to usage on the plateform after 2015. The current usage metrics is available 48-96 hours after online publication and is updated daily on week days.
Initial download of the metrics may take a while.