


Fig. 3.
Download original image
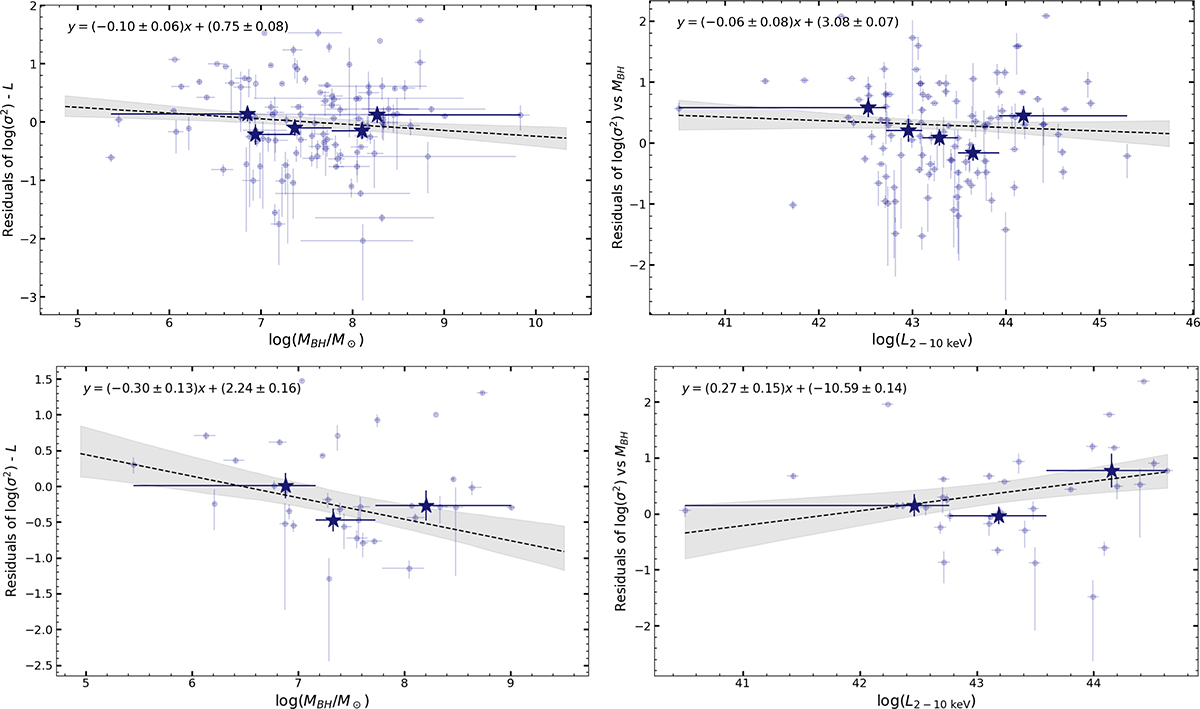
Residual analysis to assess whether black hole mass or luminosity more fundamentally drives X-ray excess variance. Upper left: Residuals from the best fit of the log(σ2)–log(L2 − 10 keV) relation plotted against log(MBH). A weak trend can be observed (α = −0.10 ± 0.06), but the obtained p-value is 0.88, against the significance of the trend. Upper right: Residuals from the log(σ2)–log(MBH) relation plotted against log(L2 − 10 keV). There is no significant trend (α = −0.06 ± 0.08), and the p-value is 0.75. These findings suggest that for this dataset, neither MBH nor L can be considered the ‘main driver’ of the variability against the other. Lower left: Same as in the upper-left panel but restricted to the RM-only sample. A 2.3σ significant negative dependence on MBH is observed. Lower right: Same as in the upper-right panel but restricted to the RM-only sample. A 2σ positive dependence on luminosity is observed. This marginally suggests that MBH is more predictive than the luminosity.
Current usage metrics show cumulative count of Article Views (full-text article views including HTML views, PDF and ePub downloads, according to the available data) and Abstracts Views on Vision4Press platform.
Data correspond to usage on the plateform after 2015. The current usage metrics is available 48-96 hours after online publication and is updated daily on week days.
Initial download of the metrics may take a while.