


Fig. 1.
Download original image
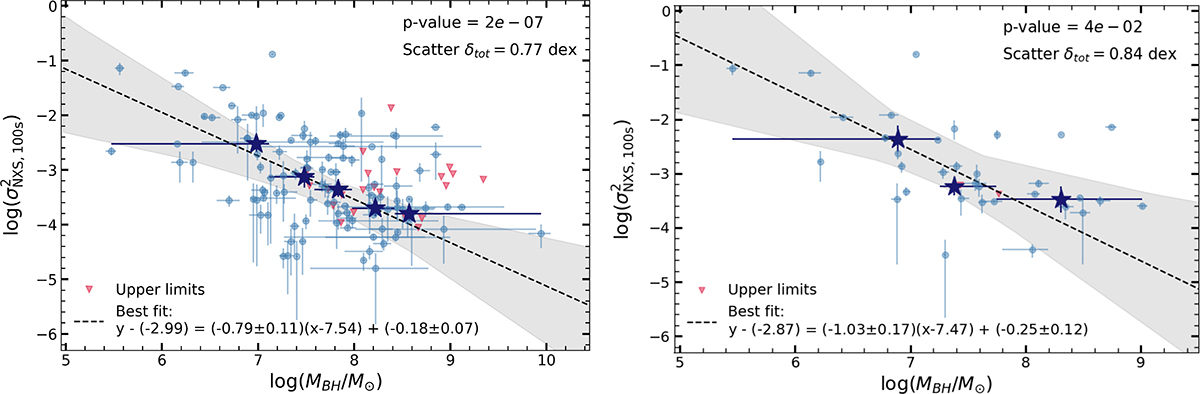
Left: Relation between the 2–10 keV excess variance (σNXS2) (obtained with time bins of 100 s) and the black hole mass (MBH) for the sample of 134 objects. Filled cyan circles show full detections; red down-pointing triangles show upper limits; the grey shaded area shows the confidence interval at 1σ for the best-fit log-linear relation. Blue stars represent the median value of the MBH and the excess variance in six MBH bins, chosen so that in each bin there are at least 20 objects. Blue error bars indicate the bin width. Blue stars are placed solely to guide the eye, as the fit is performed on the entire sample. The p-value of the relation and the total scatter δtot are displayed, together with the best fit result. The best fit is reported on the plot as  , as the fit is performed by centering the variables at their average values
  and
and  . Therefore, the true intercept of the relation is to be recovered as
  . Right: Same as the left panel but for the RM sample. The relation is steeper but consistent with what is found for the whole sample.
Current usage metrics show cumulative count of Article Views (full-text article views including HTML views, PDF and ePub downloads, according to the available data) and Abstracts Views on Vision4Press platform.
Data correspond to usage on the plateform after 2015. The current usage metrics is available 48-96 hours after online publication and is updated daily on week days.
Initial download of the metrics may take a while.