


Fig. B.1
Download original image
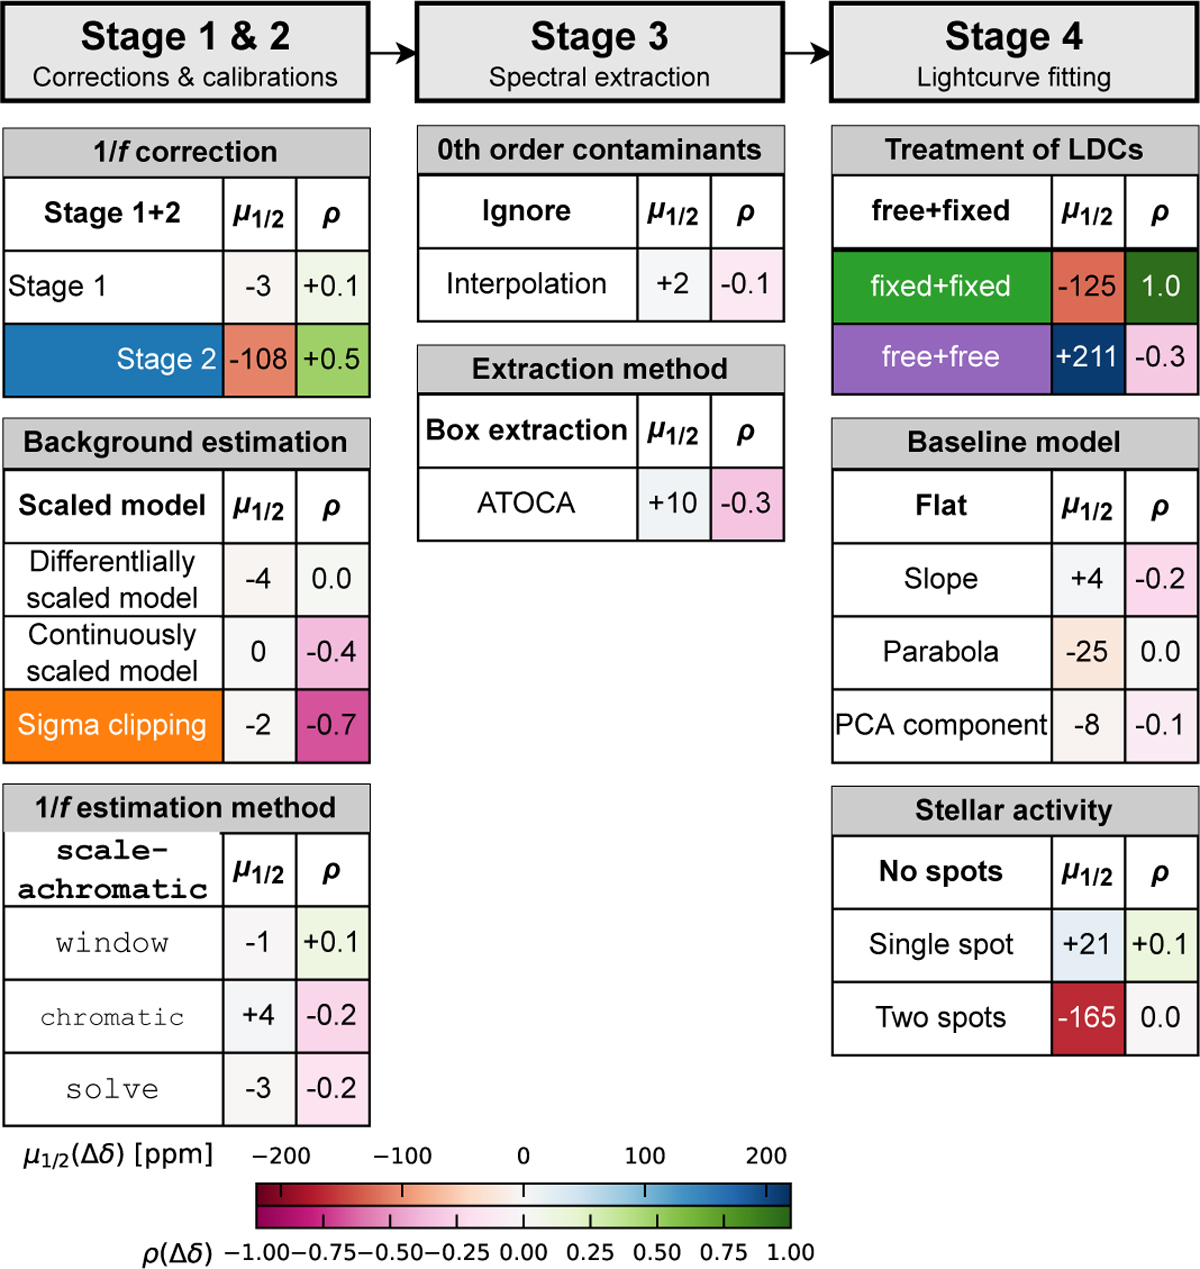
Schematic overview of the impact of the tested tweaked data reductions on the resulting transmission spectrum. Two metrics computed from the transit-depth differences relative to the standard reduction (∆δ) are reported: the weighted median μ1/2 and the Spearman rank correlation coefficient ρ, both listed and color-coded following the accompanying color bar. Tweaks are grouped by pipeline stage and ordered by execution, with the chosen method given on the left; the standard reduction choice is highlighted in bold, and select tweaked transmission spectra with large differences in trend are color-coded to match Fig. B.4).
Current usage metrics show cumulative count of Article Views (full-text article views including HTML views, PDF and ePub downloads, according to the available data) and Abstracts Views on Vision4Press platform.
Data correspond to usage on the plateform after 2015. The current usage metrics is available 48-96 hours after online publication and is updated daily on week days.
Initial download of the metrics may take a while.