


Fig. 5
Download original image
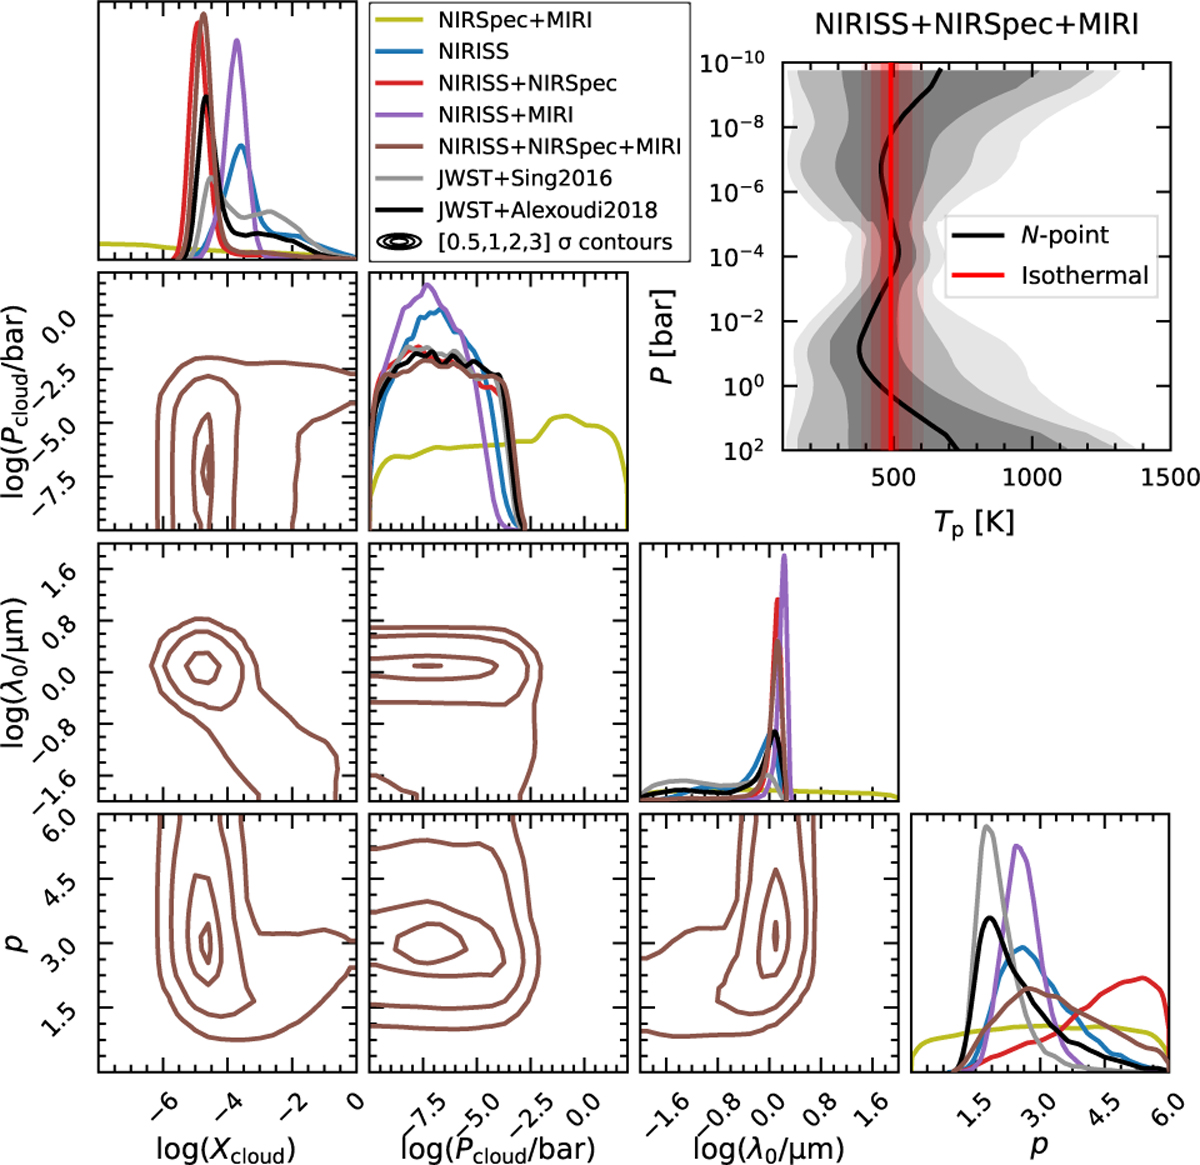
On the left, an excerpt of the corner plot focusing on parameters of the cloud parametrization is shown. The joint posterior distributions (off-diagonal panels) are only shown for the retrieval using all JWST instruments and are visualized using contour lines smoothed with a Gaussian kernel (σ = 1). The marginal posterior distributions (diagonal panels) are additionally shown for exemplary JWST instrument combinations, as well as the results from retrievals that include the two HST STIS reductions. The same kernel density estimation as in Fig. 4 was applied. Additionally, in the upper right, a comparison of T-P profiles derived for the more complex N-point and the simpler isothermal parametrizations for the case of the three JWST instrument combination is shown. The lines indicate the median value, while the shaded regions are used to highlight the [0.5, 1,2,3] σ credible intervals.
Current usage metrics show cumulative count of Article Views (full-text article views including HTML views, PDF and ePub downloads, according to the available data) and Abstracts Views on Vision4Press platform.
Data correspond to usage on the plateform after 2015. The current usage metrics is available 48-96 hours after online publication and is updated daily on week days.
Initial download of the metrics may take a while.