


Fig. 3
Download original image
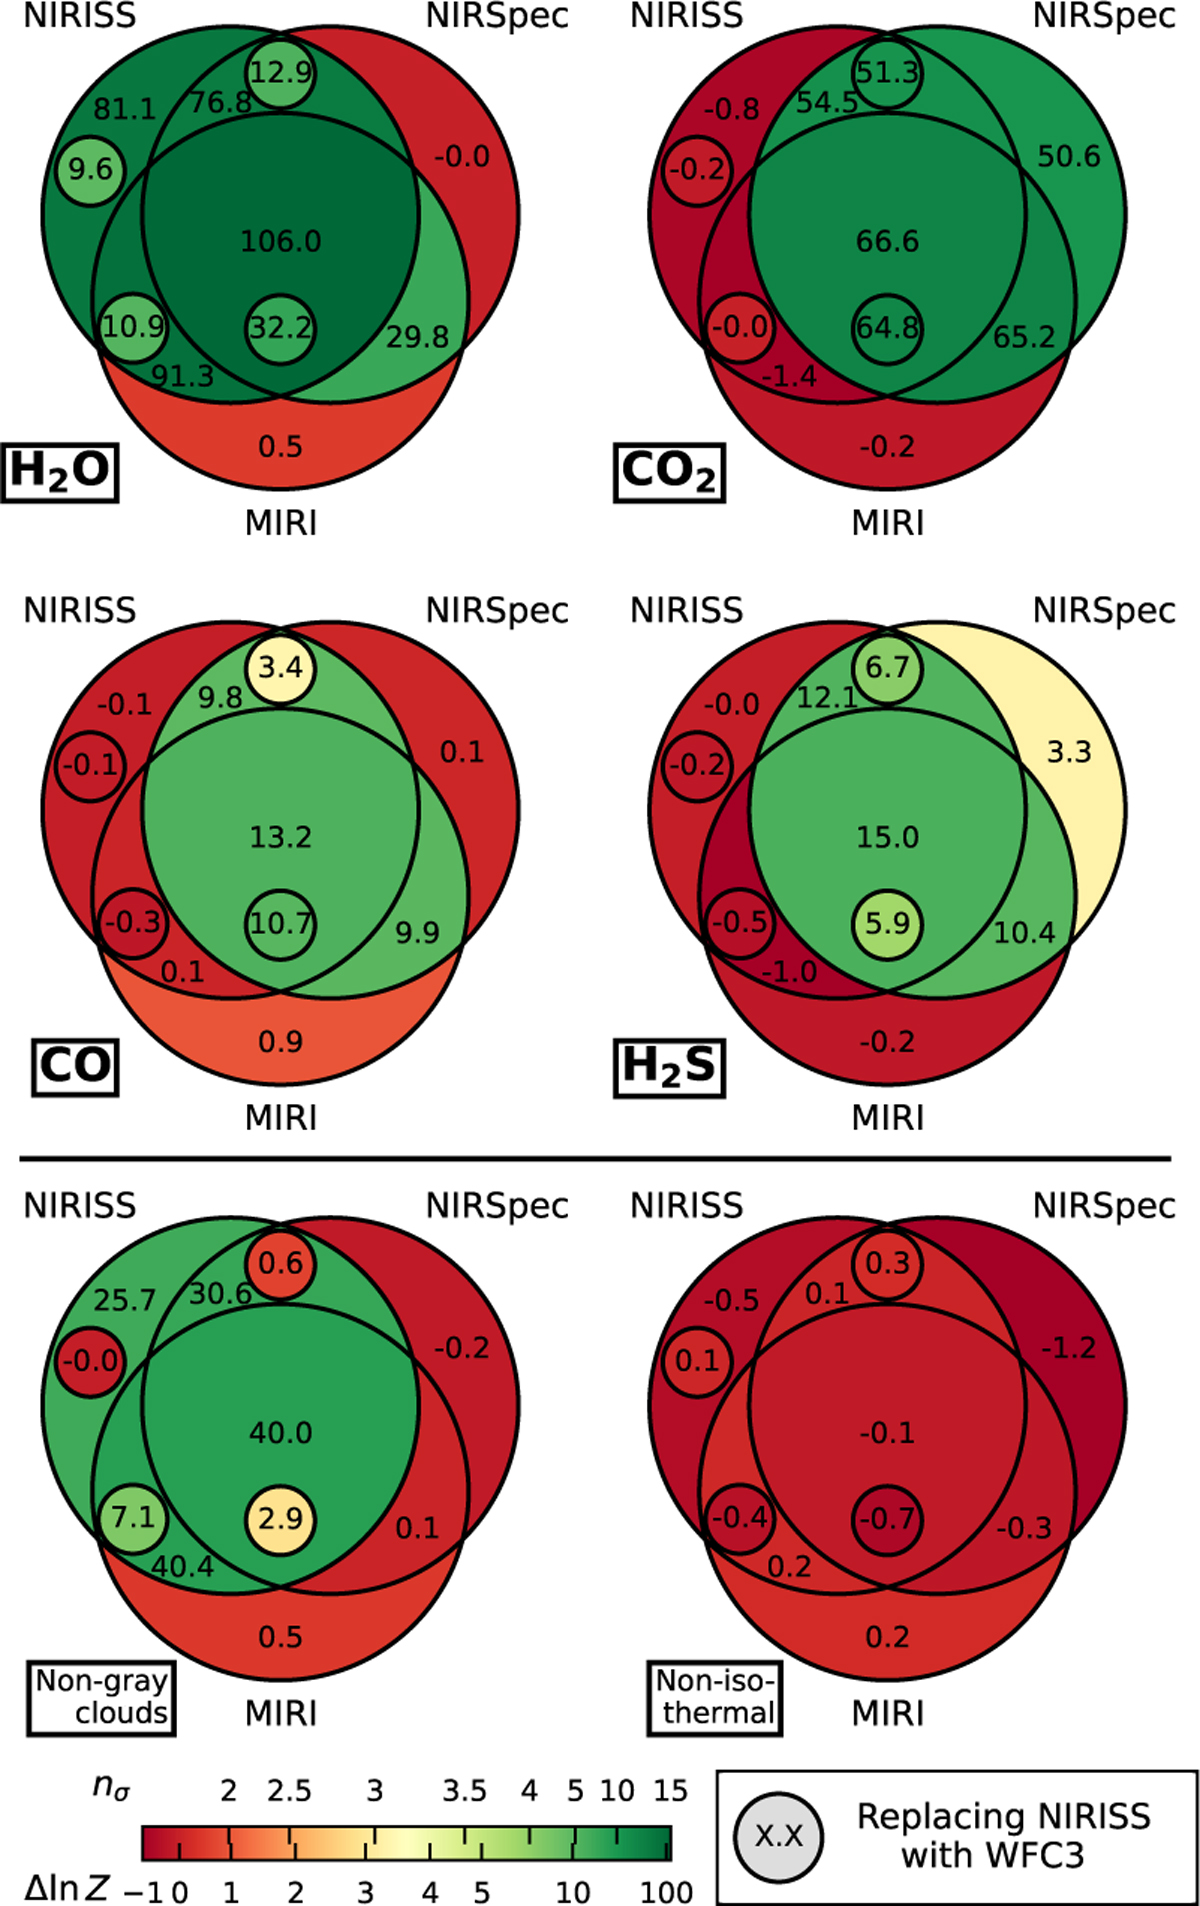
Venn diagrams of JWST instrument combinations showing detection significances of the four significantly detected molecules (top) and the preference for two modeling assumptions (bottom). Additional circles show the significances obtained when replacing the JWST NIRISS SOSS with the HST WFC3 instrument data. The significances are reported as log-evidence differences ∆ ln Z and visualized using a custom nonlinear color scale. The color bar also provides a conversion to nσ detection significances following the calibration scale from Benneke & Seager (2013).
Current usage metrics show cumulative count of Article Views (full-text article views including HTML views, PDF and ePub downloads, according to the available data) and Abstracts Views on Vision4Press platform.
Data correspond to usage on the plateform after 2015. The current usage metrics is available 48-96 hours after online publication and is updated daily on week days.
Initial download of the metrics may take a while.