| Issue |
A&A
Volume 710, June 2026
|
|
|---|---|---|
| Article Number | A52 | |
| Number of page(s) | 7 | |
| Section | Interstellar and circumstellar matter | |
| DOI | https://doi.org/10.1051/0004-6361/202557812 | |
| Published online | 28 May 2026 | |
Pulsar scintillation studies with LOFAR
III. Annual variations in PSR J0814+7429
1
State Key Laboratory of Radio Astronomy and Technology, National Astronomical Observatories, Chinese Academy of Sciences,
Beijing
100101,
China
2
University of Chinese Academy of Sciences, Chinese Academy of Sciences,
Beijing
100049,
China
3
Institute for Frontier in Astronomy and Astrophysics, Beijing Normal University,
Beijing
102206,
China
4
Fakultät für Physik, Universität Bielefeld,
Postfach 100131,
33501
Bielefeld,
Germany
5
CAS Key Laboratory of FAST, National Astronomical Observatories, Chinese Academy of Sciences,
Beijing
100101,
China
6
Guizhou Radio Astronomical Observatory, Guizhou University,
Guiyang
550001,
China
7
National Centre for Radio Astrophysics, Tata Institute of Fundamental Research,
Pune
411007,
Maharashtra,
India
8
Hamburger Sternwarte, University of Hamburg,
Gojenbergsweg 112,
21029
Hamburg,
Germany
9
Max Planck Institute for Astrophysics,
Karl-Schwarzschild-Str 1,
85741
Garching,
Germany
10
Ruhr-Universität Bochum, Fakultät für Physik und Astronomie, Astronomisches Institut,
44780
Bochum,
Germany
11
Thüringer Landessternwarte Tautenburg,
Sternwarte 5,
07778
Tautenburg,
Germany
12
Department of Physics, McGill University,
3600 rue University,
Montréal,
QC H3A 2T8,
Canada
13
Trottier Space Institute, McGill University,
3550 rue University,
Montréal,
QC H3A 2A7,
Canada
14
Dipartimento di Fisica “G. Occhialini”, Università di Milano-Bicocca,
Piazza della Scienza 3,
20126
Milano,
Italy
15
INFN, Sezione di Milano-Bicocca,
Piazza della Scienza 3,
20126
Milano,
Italy
16
INAF - Osservatorio Astronomico di Cagliari,
via della Scienza 5,
09047
Selargius (CA),
Italy
17
Leibniz-Institut für Astrophysik Potsdam (AIP),
An der Sternwarte 16,
14482
Potsdam,
Germany
18
Max-Planck-Institut für Radioastronomie,
Auf dem Hügel 69,
53121
Bonn,
Germany
19
National Space Science Center, Chinese Academy of Sciences,
Beijing
100190,
China
★ Corresponding authors: This email address is being protected from spambots. You need JavaScript enabled to view it.
; This email address is being protected from spambots. You need JavaScript enabled to view it.
Received:
24
October
2025
Accepted:
1
April
2026
Abstract
Context. The interstellar scintillation observed in radio pulsars arises from interference between electromagnetic waves scattered by electron density fluctuations in the turbulent interstellar plasma, providing a critical tool for probing the small-scale structure of the ionized interstellar medium and the pulsar system itself.
Aims. The primary aim of this work is to study long-term scintillation variations for a bright and nearby pulsar, PSR J0814+7429, carried out from September 2013 to September 2023 with the LOw-Frequency ARray (LOFAR) High Band Antennae in the frequency range 120-170 MHz.
Methods. We derived the basic scintillation parameters, scintillation bandwidth (Δνd), and scintillation timescale (Δτd) from the twodimensional (2D) auto-covariance function of the dynamic spectra that are a 2D matrix of pulse intensity as a function of time and frequency.
Results. We present a long-term monitoring study of Δνd and Δτd for PSR J0814+7429, which shows a strong annual variation in the time series of the Δτd. From our modeling of the annual variations of scintillation velocities, the scattering screen is anisotropic and located at 0.23 ± 0.02 kpc from the Earth, likely corresponding to the boundary of the Local Bubble.
Key words: ISM: general / pulsars: individual: PSR J0814+7429
© The Authors 2026
 Open Access article, published by EDP Sciences, under the terms of the Creative Commons Attribution License (https://creativecommons.org/licenses/by/4.0), which permits unrestricted use, distribution, and reproduction in any medium, provided the original work is properly cited.
This article is published in open access under the Subscribe to Open model. This email address is being protected from spambots. You need JavaScript enabled to view it. to support open access publication.
1 Introduction
Pulsars are highly magnetized, rapidly rotating neutron stars that appear to emit highly periodic electromagnetic radiation pulses as their lighthouse-like radiation beams sweep across the observer. Pulsar emission can be detected across various wavelengths such as radio (Hewish et al. 1968), X-ray (Bachetti et al. 2014), and gamma rays (Abdo et al. 2013). As these radio signals of pulsars propagate through electron density turbulence in the ionized interstellar medium (IISM), they get scattered and then the interference between these scattered signals results in a modulation of the pulse intensity as a function of frequency and time, forming an interference pattern on the observer plane (Rickett 1990). This phenomenon, known as interstellar scintillation (ISS, Scheuer 1968), has become an important tool for probing the properties of the IISM (Rickett 1977, 1990; Narayan 1992) and studying binary pulsar systems (Lyne 1984; Rickett et al. 2014). In addition, analysis of ISS in precisely timed pulsars may be used to generate timing corrections for gravitational-wave characterization by pulsar timing arrays (Verbiest et al. 2021), such as the Chinese Pulsar Timing Array (Xu et al. 2023), European Pulsar Timing Array (EPTA Collaboration 2023), Parkes Pulsar Timing Array (Reardon et al. 2023), and North-American Nanohertz Observatory for Gravitational Waves (Agazie et al. 2023), thereby enhancing the probability of detecting gravitational waves.
There are two main types of ISS: diffractive ISS (DISS) and refractive ISS (RISS). DISS arises from small-scale density fluctuations in the IISM and is typically observed with characteristic timescales ranging from minutes to hours (Rickett 1969; Wu et al. 2022; Liu et al. 2022). RISS originates from larger-scale density gradients and manifests over weeks to months (Sieber 1982; Rickett & Lyne 1990). The interference effects produced by ISS are measurable from dynamic spectra, which are twodimensional (2D) representations of pulse intensity as a function of observing time and radio frequency. The characteristic time and frequency widths of scintles can be parameterized using the scintillation timescale, Δτd, and scintillation bandwidth, Δνd, both of which can be obtained from the 2D autocorrelation function (2D ACF) of the dynamic spectrum (Cordes et al. 1986; Wang et al. 2005). In general, Δνd is highly frequency-dependent and Δτd is relatively weakly frequency-dependent, and also modulated by the relative motions between the pulsar, the scattering medium, and the observer.
In some cases, the long time series of Δτd shows an annual variation and it is also possible to show orbital variations if the pulsar is in a binary system (Lyne 1984). By employing these variations, we can determine the small-scale distribution and inhomogeneities of the IISM. Alternatively, we might also be able to obtain a number of orbital parameters that are difficult to measure with the pulsar timing method alone. For example, Reardon et al. (2019) used long-term scintillation of PSR J1141-6545, which shows orbital and annual variations, to resolve ambiguity in the sense of the inclination angle. Recently, Liu et al. (2023) also used the annual and orbit of variations to measure the distance, velocity, and degree of anisotropy of the scattering screen for PSRs J0613-0200 and J0636+5128, their results further add to the growing evidence of the Local Bubble shell as a dominant region of scattering along many lines of sights. The Local Bubble, which is a cavity of hot, tenuous, X-ray emitting gas surrounding the Solar System, likely created by past supernova explosions or stellar winds (Cox & Reynolds 1987; McCammon & Sanders 1990). In addition to the above pulsars, the following pulsars also had their annual and orbital variations studied: J0737-3039A (Rickett et al. 2014), J0437-4715 (Reardon et al. 2020), and J1603-7202 (Walker et al. 2022). However, the number of pulsars that have been reported with orbit or annual variations is very small, accounting for only a small fraction of the total number of pulsars.
The LOw Frequency ARray (LOFAR, van Haarlem et al. 2013) provides unique advantages for ISS studies, owing to the strong frequency dependence of ISS. Previous works have already presented the census of DISS pulsars at LOFAR frequencies (Wu et al. 2022) and also reported on a non-standard frequency-dependence of the scattering properties using near-simultaneous observations from LOFAR and the New extension in Nançay upgrading LOFAR (NenuFAR, Wu et al. 2023). In this paper, we present long-term scintillation monitoring of PSR J0814+7429 with LOFAR. This pulsar was discovered by Cole & Pilkington (1968) and it provided one of the richest contexts for studying pulsar emission physics. In Section 2, we describe our observations and data processing. The analysis results and the discussion are presented in Section 3. The conclusion is given in Section 4.
LOFAR HBAs observational campaign for PSR J0814+7429.
2 Observations and data processing
The observations of PSR J0814+7429 presented in this study were conducted between September 2013 and September 2023, covering a selected frequency range of 120-170 MHz after omitting the first and last 10 MHz bands contaminated by radio frequency interference (RFI). Over this decade-long campaign, we collected 1304 high band antenna (HBA) observations. Six LOFAR stations were utilized for these measurements: DE601-Effelsberg, DE602-Unterweilenbach, DE603-Tautenburg, DE604-Bornim, DE605-Jülich, and DE609-Norderstedt (see Table 1 for specifications). All observations used in our work have been done in stand alone mode using the stations individually. To ensure coverage of more scintles in the dynamic spectra, our analysis focuses on observations lasting at least 30 minutes. The data are recorded with a frequency resolution of 0.195 MHz per channel and a typical temporal resolution of 60 seconds per subintegration. The data processing pipeline closely follows the methodology described by Wu et al. (2022); further details on observation protocols, raw data reduction, and scintillation parameter extraction can be found in Section 2 of that work. After data processing, all dynamic spectra are visually inspected, and those seriously contaminated by RFI are excluded using ITERATIVE_CLEANER1. A representative cleaned dynamic spectrum is displayed in Figure 1. The long-term evolution of the scintillation bandwidth (Δνd, bottom panel) and timescale (Δτd, top panel) for PSR J0814+7429 is presented in Figure 2. Notably, the Δτd time series exhibits a pronounced annual variation, which provides critical insights into the properties of the IISM, as discussed in the next section.
3 Results and discussion
In this section, we present our methodology for modeling the annual variations in scintillation properties observed in PSR J0814+7429 and report the corresponding analysis results. For a more comprehensive analysis of annual scintillation variations and detailed discussions of these phenomena in pulsar systems, we refer to the recent work by Reardon et al. 2019; Liu et al. 2023.
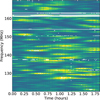 |
Fig. 1 Example dynamic spectrum of PSR J0814+7429 with LOFAR taken on MJD 57 361. The white patches are removed due to RFI. |
3.1 Scintillation from a thin screen
The distribution of IISM responsible for the observed ISS is complex along the line of sight between the pulsar and the observer. In this paper, we consider a simple thin screen model for the medium distribution in the case of PSR J0814+7429, which is supported by the detection of a scintillation arc (Wu et al. 2022). For a thin screen model, Cordes & Rickett (1998) presented that the scintillation velocity, VISS, which is the ratio of the spatial scale of the diffraction pattern to the scintillation timescale, Δτd, can be estimated from the scintillation parameters,
 (1)
(1)
where D is the distance from the observer to the pulsar in kpc, f is the observing frequency in GHz, Δνd is in units of MHz, and Δτd is in units of seconds. The factor AISS depends on the geometry, the location of the scattering screen, and the form of the turbulence spectrum. Cordes & Rickett (1998) derived AISS = 2.5 × 10⁴ km s−1 for a uniform medium, while for a thin screen model, AISS = 2.78 × 10⁴ $$ km s−1, where Ds represents the distance of the scattering screen from the Earth and is in units of kpc. Over the past two decades, evidence of anisotropic scattering has been growing in many cases, including pulsars (Stinebring et al. 2001; Brisken et al. 2010; Wu et al. 2022; Main et al. 2023) and fast radio bursts (Wu et al. 2024b,a). Moreover, Stinebring et al. (2022) presented that approximately 20% of the pulsars within their sample show evidence of the existence of anisotropy of scattering. Therefore, in this work, we consider an anisotropic scattering screen and the anisotropy-dependent value AISS. This can be given by  (Rickett et al. 2014), where Ar is the axial ratio of anisotropy under assuming the spatial diffraction pattern as an ellipse (Coles et al. 2005).
In the thin screen model, the scintillation velocity VISS at the observer (Liu et al. 2023) can be predicted as
 (2)
(2)
where Veff represents the effective scintillation velocity which is a combination of the pulsar’s, the Earth’s, and the IISM’s transverse velocities weighted by the fraction of distance of the scattering screen (Cordes & Rickett 1998), expressed as
 (3)
(3)
where VE is the Earth velocity, Vp is the pulsar’s binary orbital transverse velocity, Vμ is the pulsar proper motion transverse velocity, and VIISM is the transverse velocity of the IISM. For a solitary pulsar system, Vp is zero. Similarly to the approach taken by Liu et al. 2023, we integrated Equations (1) and (2) into the following formula,
 (4)
(4)
where all the scintillation observables are combined in the definition of Q. The uncertainty of Q is mainly from the statistical uncertainties of scintillation parameters.
For the effective transverse velocity, |Veff|, we take it in equatorial coordinates, employing the quadratic form from Rickett et al. (2014) as
 (5)
(5)
where Veff,α and Veff,δ are the components of the effective velocity in right ascension (α) and in declination (δ), respectively. Based on the assumption that the spatial diffraction pattern is an ellipse (as mentioned above), the coefficients a, b, and c are parameterized by the axial ratio, Ar, of the ellipse and the orientation angle, ψ, of the Ar. Considering the orientation angle, ψ, is defined clockwise from the right ascension of the pulsar, (Rickett et al. 2014), the coefficients are
![Mathematical equation: \begin{split} a &= [1-R\cos(2\psi)]/\sqrt{1-R^{2}},\\ b &= [1+R\cos(2\psi)]/\sqrt{1-R^{2}},\\ c &= -2R\sin(2\psi)/\sqrt{1-R^{2}}, \end{split}](/articles/aa/full_html/2026/06/aa57812-25/aa57812-25-eq7.png) (6)
(6)
where R is a scaled parameter for Ar:  , bound between 0 and 1.
3.2 Fitting annual variations
Similarly to Reardon et al. (2019) and Liu et al. (2023), for the value of the ∆νd in Equation (1), we used the average value of all Δνd observations. Via Equation (3), Veff incorporates three transverse velocity components for PSR J0814+7429: the pulsar’s proper motion, Earth’s orbital motion, and the velocity of the scattering screen. We derived the Earth’s velocity using SCINTOOLS2 (Reardon et al. 2020). The pulsar’s transverse velocity, Vμ, was obtained from Brisken et al. (2002). The distance to PSR J0814+7429, D=0.432 kpc, was adopted from Verbiest et al. (2012). Finally, the scintillation velocity model of PSR J0814+7429 includes five free parameters in the anisotropic scattering case: VIISM,α, VIISM,δ, Ar, ψ, and Ds.
We modelled the time series of the parameters Q using a Markov chain Monte Carlo (MCMC) with EMCEE (Foreman-Mackey et al. 2013). All fitting parameters have uniform priors and their posterior distributions are presented in Fig. A.1. We computed a reduced χ2 value of 2.40 for the thin screen model. This value is slightly larger than unity, but the residuals between the observed and predicted scintillation velocities in the bottom panel of Figure 3 are approximately Gaussian-distributed and exhibit no systematic patterns, indicating that the model provides an overall satisfactory description of the data. The modest deviation from unity likely reflects minor underestimation of the measurement uncertainties due to the limited frequency resolution, rather than a significant deficiency in the model itself. Therefore, considering possible underestimation of measurement uncertainties, this model can provide a reasonably good fit to the data. The best-fit parameters for VIISM,α, VIISM,δ, Ar, ψ, and Ds are -50 ± 10 km s−1, -21−8 km s−1, 2.0 ± 0.3,  degrees and 0.23 ± 0.02 kpc, respectively. The axial ratio, Ar, of the spatial diffraction pattern is 2.0 ± 0.3, which is in agreement with the mildly anisotropic scattering model. Our results would predict a scintillation arc curvature of ∼4.2 s3 at 145 MHz at MJD 57872, which is different from 2.5 s3 (Wu et al. 2022) using η ∝ f−2 (Stinebring et al. 2019). This could indicate that there are multiple scattering screens along the line of sight (Ocker et al. 2024). In Fig. 3, we show the variation of the scintillation velocities as a function of day of year, where the scintillation velocity from Equation (1) is denoted by the gray point with error bar and the one from Equation (2) by the solid black curve. We can see that there is a clear annual variation in these scintillation velocities, caused by the annual change in the Earth’s velocity.
The values of |VIISM,α| and |VIISM,δ| seem to be larger than the expected average plasma velocity of about 10 km s−1 (Goldreich & Sridhar 1995) in the IISM. After considering the differential rotation of the galaxy, the transverse velocity of the scattering screen is still about 48 km/s. Similar larger IISM velocities in other pulsars are also reported (Rickett et al. 2014). Due to the limited understanding of the plasma’s origin, it is difficult to determine whether these larger IISM velocities are unusual or unreasonable (Reardon et al. 2020).
The screen distance was measured to be Ds = 0.23 ± 0.02 kpc for PSR J0814+7429. Rickett et al. (2000) studied the characteristics of the scattering medium through long-term monitoring of the weak scintillation for PSR J0814+7429. And they proposed that scattering of this pulsar is consistent with either an extended scattering medium along the entire line of sight or a localized compact structure in the range 170-220 pc (with a pulsar distance of 310 pc (Taylor & Cordes 1993)) from the Earth. Their distance-revised screen distance is fully consistent with our result.
Currently, observed ISS phenomena have been suggested to be caused by the boundary of the Local Bubble (e.g., Bhat et al. 1998), HII regions (Mall et al. 2022), hot stars (Walker et al. 2017), and supernova remnants (Yao et al. 2021). We found no associated HII regions in a search of the Wide-field Infrared Survey Explorer (WISE: Anderson et al. 2014) along the line of sight for PSR J0814+7429. We further searched the Gaia DR3 catalogue (Gaia Collaboration 2023) for the presence of hot stars in close proximity to the line of sight, without reliable hot stars to contribute to the scattering of PSR J0814+7429. However, the distance of the scattering screen of PSR J0814+7429 is consistent with the shell of the local bubble, which is similar to earlier findings for PSRs J0613-0200 and J0636+5128 (Liu et al. 2023), implying that the evidence of the boundary of the local bubble could be a dominant region of scattering along the line of sight to PSR J0814+7429. In addition, recent low-frequency Faraday tomography observations from the LOFAR Two-Metre Sky Survey (LoTSS, Erceg et al. 2024a,b) revealed that the Local Bubble is bounded by a magnetised and partially ionised shell located about 40-200 pc, which potentially contributes to the observed scintillation behaviours of pulsars. However, a recent work by Ocker et al. (2024) noted that accurately associating the scattering screens with the Bubble’s boundary remains difficult, due to uncertainties in both the screen distances and the Bubble’s modeled surface. More observations are needed to further provide additional evidence linking scattering screens of pulsars to the Bubble’s boundary.
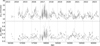 |
Fig. 2 Long-term variations of scintillation timescale Δτd (top panel) and scintillation bandwidth Δνd (bottom panel) for PSR J0814+7429. The vertical gray dotted lines indicate the start of a calendar year. More observations in 2017 resulted in relatively dense data points this year. |
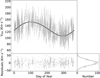 |
Fig. 3 Top panel: scintillation velocities of PSR J0814+7429 as a function of day of year. The points with error bars are the scintillation velocities from Equation (1) and the curve shown is that from Equation (2). The residuals between the two scintillation velocities are shown in the bottom left panel. In addition, the residual histogram distribution with Gaussian fitting (gray dashed line) is shown in the bottomright panel. |
4 Conclusion
In this paper, we present an analysis of long-term scintillation monitoring for the solitary PSR J0814+7429. This has been accomplished across a data span of ≈ 10 yr observed with LOFAR. The annual variation in ISS can be explained as an annual modulation by the orbital motion of the Earth. Under the framework of an anisotropic thin scattering screen model, we have modeled the annual variations of scintillation parameters. The value of axis ratio Ar is 2.0 ± 0.3, which is in agreement with the mildly anisotropic scattering model. We also constrain the screen distance approximately halfway between the pulsar and the Earth at Ds = 0.23 ± 0.02 kpc. Along the line of sight at this distance, we suggest that the scattering screen of PSR J0814+7429 is very likely associated with the boundary of the Local Bubble.
For pulsars with scattering screens close to Earth, longterm scintillation monitoring for them could more readily reveal annual variations similar to those observed in PSR J0814+7429. We have once again demonstrated the feasibility of using LOFAR for ISS studies of pulsars. Further long-term ISS monitoring on other pulsars will be released in the future, with a view to provide more clues to identify the ISS mechanism and the astrophysical structures responsible for ISS.
Acknowledgements
We thank the anonymous referee for the constructive comments and suggestions, which helped us to improve the presentation of this paper. This work is supported by NSFC grant No. 12503056, grants from Beijing Nova Program (No. 20250484786), National Science Foundation, China, no. 12421003, the CAS-MPG LEGACY project, the Max-Planck Partner Group, the Strategic Priority Research Program of the Chinese Academy of Sciences (Nos. XDA0350501), and the Major Science and Technology Program of Xinjiang Uygur Autonomous Region, grant No. 2022A03013-2. J.P.W.V. acknowledges support by the Deutsche Forschungsgemeinschaft (DFG) through the Heisenberg programme (Project No. 433075039). M.B. acknowledges support by the Deutsche Forschungsgemeinschaft (DFG, German Research Foundation) under Germany’s Excellence Strategy - EXC 2121 ‘Quantum Universe’ -390833306. M.H. acknowledges support from the Federal Ministry of Research, Technology and Space (BMFTR) ErUM-Pro under grant 05A23STA. R.J.D. acknowledges support from BMFTR ErUM-Pro under grant 05A23PC2. D.J.S. acknowledges support from BMBFT ErUM-Pro under grant 05A23PB1. LOFAR (van Haarlem et al. 2013) is the Low Frequency Array designed and constructed by ASTRON. It has observing, data processing, and data storage facilities in several countries, that are owned by various parties (each with their own funding sources), and that are collectively operated by the ILT foundation under a joint scientific policy. The ILT resources have benefitted from the following recent major funding sources: CNRS-INSU, Observatoire de Paris and Université d’Orléans, France; BMFTR, MIWF-NRW, MPG, Germany; Science Foundation Ireland (SFI), Department of Business, Enterprise and Innovation (DBEI), Ireland; NWO, The Netherlands; The Science and Technology Facilities Council, UK. This paper uses data obtained with the German LOFAR stations, during station-owners time and ILT time allocated under project codes LC0_014, LC1_048, LC2_011, LC3_029, LC4_025, LT5_001, LC9_039, LT10_014 and LT14_006. We made use of data from the Effelsberg (DE601) LOFAR station funded by the Max-Planck-Gesellschaft; the Unterweilenbach (DE602) LOFAR station funded by the Max-Planck-Institut für Astrophysik, Garching; the Tautenburg (DE603) LOFAR station funded by the State of Thuringia, supported by the European Union (EFRE) and the BMFTR Verbundforschung project D-LOFAR I (grant 05A08ST1); the Potsdam (DE604) LOFAR station funded by the Leibniz-Institut für Astrophysik (AIP), Potsdam; the Jülich (DE605) LOFAR station supported by the BMFTR Verbundforschung project D-LOFAR I (grant 05A08LJ1); and the Norderstedt (DE609) LOFAR station funded by the BMFTR Verbundforschung project D-LOFAR II (grant 05A11LJ1). The observations of the German LOFAR stations were carried out in stand-alone GLOW mode, which is technically operated and supported by the Max-Planck-Institut für Radioastronomie, the Forschungszentrum Jülich and Bielefeld University. We acknowledge support and operation of the GLOW network, computing and storage facilities by the FZ-Jülich, the MPIfR and Bielefeld University and financial support from BMFTR D-LOFAR III (grant 05A14PBA) and D-LOFAR IV (grant 05A17PBA), and by the states of Nordrhein-Westfalia and Hamburg.
References
- Abdo, A. A., Ajello, M., Allafort, A., et al. 2013, ApJS, 208, 17 [Google Scholar]
- Agazie, G., Anumarlapudi, A., Archibald, A. M., et al. 2023, ApJ, 951, L8 [NASA ADS] [CrossRef] [Google Scholar]
- Anderson, L. D., Bania, T. M., Balser, D. S., et al. 2014, ApJS, 212, 1 [Google Scholar]
- Bachetti, M., Harrison, F. A., Walton, D. J., et al. 2014, Nature, 514, 202 [NASA ADS] [CrossRef] [Google Scholar]
- Bhat, N. D. R., Gupta, Y., & Rao, A. P. 1998, ApJ, 500, 262 [NASA ADS] [CrossRef] [Google Scholar]
- Brisken, W. F., Benson, J. M., Goss, W. M., & Thorsett, S. E. 2002, ApJ, 571, 906 [NASA ADS] [CrossRef] [Google Scholar]
- Brisken, W. F., Macquart, J.-P., Gao, J. J., et al. 2010, ApJ, 708, 232 [NASA ADS] [CrossRef] [Google Scholar]
- Cole, T. W., & Pilkington, J. D. H. 1968, Nature, 219, 574 [NASA ADS] [CrossRef] [Google Scholar]
- Coles, W. A., McLaughlin, M. A., Rickett, B. J., Lyne, A. G., & Bhat, N. D. R. 2005, ApJ, 623, 392 [NASA ADS] [CrossRef] [Google Scholar]
- Cordes, J. M., & Rickett, B. J. 1998, ApJ, 507, 846 [NASA ADS] [CrossRef] [Google Scholar]
- Cordes, J. M., Pidwerbetsky, A., & Lovelace, R. V. E. 1986, ApJ, 310, 737 [Google Scholar]
- Cox, D. P., & Reynolds, R. J. 1987, Ann. Rev. Astr. Ap., 25, 303 [Google Scholar]
- EPTA Collaboration, InPTA Collaboration (Antoniadis, J., et al.) 2023, A&A, 678, A50 [CrossRef] [EDP Sciences] [Google Scholar]
- Erceg, A., Jelic, V., Haverkorn, M., et al. 2024a, A&A, 687, A23 [NASA ADS] [CrossRef] [EDP Sciences] [Google Scholar]
- Erceg, A., Jelic, V., Haverkorn, M., et al. 2024b, A&A, 688, A200 [NASA ADS] [CrossRef] [EDP Sciences] [Google Scholar]
- Foreman-Mackey, D., Hogg, D. W., Lang, D., & Goodman, J. 2013, PASP, 125, 306 [Google Scholar]
- Gaia Collaboration (Vallenari, A., et al.) 2023, A&A, 674, A1 [NASA ADS] [CrossRef] [EDP Sciences] [Google Scholar]
- Goldreich, P., & Sridhar, S. 1995, ApJ, 438, 763 [Google Scholar]
- Hewish, A., Bell, S. J., Pilkington, J. D. H., Scott, P. F., & Collins, R. A. 1968, Nature, 217, 709 [NASA ADS] [CrossRef] [Google Scholar]
- Liu, Y., Verbiest, J. P. W., Main, R. A., et al. 2022, A&A, 664, A116 [NASA ADS] [CrossRef] [EDP Sciences] [Google Scholar]
- Liu, Y., Main, R. A., Verbiest, J. P. W., et al. 2023, Sci. China Phys. Mech. Astron., 66, 119512 [Google Scholar]
- Lyne, A. G. 1984, Nature, 310, 300 [Google Scholar]
- Main, R. A., Parthasarathy, A., Johnston, S., et al. 2023, MNRAS, 518, 1086 [Google Scholar]
- Mall, G., Main, R. A., Antoniadis, J., et al. 2022, MNRAS, 511, 1104 [CrossRef] [Google Scholar]
- McCammon, D., & Sanders, W. T. 1990, ARA&A, 28, 657 [NASA ADS] [CrossRef] [Google Scholar]
- Narayan, R. 1992, Philos. Trans. Roy. Soc. London A, 341, 151 [Google Scholar]
- Ocker, S. K., Cordes, J. M., Chatterjee, S., et al. 2024, MNRAS, 527, 7568 [Google Scholar]
- Reardon, D. J., Coles, W. A., Hobbs, G., et al. 2019, MNRAS, 485, 4389 [NASA ADS] [CrossRef] [Google Scholar]
- Reardon, D. J., Coles, W. A., Bailes, M., et al. 2020, ApJ, 904, 104 [NASA ADS] [CrossRef] [Google Scholar]
- Reardon, D. J., Zic, A., Shannon, R. M., et al. 2023, ApJ, 951, L6 [NASA ADS] [CrossRef] [Google Scholar]
- Rickett, B. J. 1969, Nature, 221, 158 [NASA ADS] [CrossRef] [Google Scholar]
- Rickett, B. J. 1977, Ann. Rev. Astr. Ap., 15, 479 [NASA ADS] [CrossRef] [Google Scholar]
- Rickett, B. J. 1990, Ann. Rev. Astr. Ap., 28, 561 [NASA ADS] [CrossRef] [Google Scholar]
- Rickett, B. J., & Lyne, A. G. 1990, MNRAS, 244, 68 [NASA ADS] [Google Scholar]
- Rickett, B. J., Coles, W. A., & Markkanen, J. 2000, ApJ, 533, 304 [NASA ADS] [CrossRef] [Google Scholar]
- Rickett, B. J., Coles, W. A., Nava, C. F., et al. 2014, ApJ, 787, 161 [NASA ADS] [CrossRef] [Google Scholar]
- Scheuer, P. A. G. 1968, Nature, 218, 920 [NASA ADS] [CrossRef] [Google Scholar]
- Sieber, W. 1982, A&A, 113, 311 [NASA ADS] [Google Scholar]
- Stinebring, D. R., McLaughlin, M. A., Cordes, J. M., et al. 2001, ApJ, 549, L97 [NASA ADS] [CrossRef] [Google Scholar]
- Stinebring, D. R., Rickett, B. J., & Ocker, S. K. 2019, ApJ, 870, 82 [NASA ADS] [CrossRef] [Google Scholar]
- Stinebring, D. R., Rickett, B. J., Minter, A. H., et al. 2022, ApJ, 941, 34 [Google Scholar]
- Taylor, J. H., & Cordes, J. M. 1993, ApJ, 411, 674 [Google Scholar]
- van Haarlem, M. P., Wise, M. W., Gunst, A. W., et al. 2013, A&A, 556, A2 [NASA ADS] [CrossRef] [EDP Sciences] [Google Scholar]
- Verbiest, J. P. W., Weisberg, J. M., Chael, A. A., Lee, K. J., & Lorimer, D. R. 2012, ApJ, 755, 39 [NASA ADS] [CrossRef] [Google Scholar]
- Verbiest, J. P. W., Oslowski, S., & Burke-Spolaor, S. 2021, in Handbook of Gravitational Wave Astronomy, eds. C. Bambi, S. Katsanevas, & K. D. Kokkotas (Berlin: Springer), 4 [Google Scholar]
- Walker, M. A., Tuntsov, A. V., Bignall, H., et al. 2017, ApJ, 843, 15 [Google Scholar]
- Walker, K., Reardon, D. J., Thrane, E., & Smith, R. 2022, ApJ, 933, 16 [Google Scholar]
- Wang, N., Manchester, R. N., Johnston, S., et al. 2005, MNRAS, 358, 270 [NASA ADS] [CrossRef] [Google Scholar]
- Wu, Z., Verbiest, J. P. W., Main, R. A., et al. 2022, A&A, 663, A116 [NASA ADS] [CrossRef] [EDP Sciences] [Google Scholar]
- Wu, Z., Coles, W. A., Verbiest, J. P. W., et al. 2023, MNRAS, 520, 5536 [Google Scholar]
- Wu, Z., Zhu, W., Zhang, B., et al. 2024a, ApJ, 969, L23 [Google Scholar]
- Wu, Z.-W., Main, R. A., Zhu, W.-W., et al. 2024b, Sci. China Phys. Mech. Astron., 67, 219512 [Google Scholar]
- Xu, H., Chen, S., Guo, Y., et al. 2023, Res. Astron. Astrophys., 23, 075024 [CrossRef] [Google Scholar]
- Yao, J., Zhu, W., Manchester, R. N., et al. 2021, Nat. Astron., 5, 788 [NASA ADS] [CrossRef] [Google Scholar]
Appendix A Posterior probability distributions for the fitted parameters during MCMC
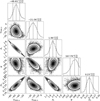 |
Fig. A.1 The posterior probability distributions of all fitted parameters. From left to right in each 1D histogram, three black dashed lines denote the 16% fractional percentiles, the most likely values, and the 84% fractional percentiles, respectively. The most likely values and the upper/lower errors are indicated at the top of the 1D histograms. |
All Tables
All Figures
|
Fig. 1 Example dynamic spectrum of PSR J0814+7429 with LOFAR taken on MJD 57 361. The white patches are removed due to RFI. |
| In the text | |
|
Fig. 2 Long-term variations of scintillation timescale Δτd (top panel) and scintillation bandwidth Δνd (bottom panel) for PSR J0814+7429. The vertical gray dotted lines indicate the start of a calendar year. More observations in 2017 resulted in relatively dense data points this year. |
| In the text | |
|
Fig. 3 Top panel: scintillation velocities of PSR J0814+7429 as a function of day of year. The points with error bars are the scintillation velocities from Equation (1) and the curve shown is that from Equation (2). The residuals between the two scintillation velocities are shown in the bottom left panel. In addition, the residual histogram distribution with Gaussian fitting (gray dashed line) is shown in the bottomright panel. |
| In the text | |
|
Fig. A.1 The posterior probability distributions of all fitted parameters. From left to right in each 1D histogram, three black dashed lines denote the 16% fractional percentiles, the most likely values, and the 84% fractional percentiles, respectively. The most likely values and the upper/lower errors are indicated at the top of the 1D histograms. |
| In the text | |
Current usage metrics show cumulative count of Article Views (full-text article views including HTML views, PDF and ePub downloads, according to the available data) and Abstracts Views on Vision4Press platform.
Data correspond to usage on the plateform after 2015. The current usage metrics is available 48-96 hours after online publication and is updated daily on week days.
Initial download of the metrics may take a while.