


| Issue |
A&A
Volume 710, June 2026
|
|
|---|---|---|
| Article Number | A116 | |
| Number of page(s) | 13 | |
| Section | Planets, planetary systems, and small bodies | |
| DOI | https://doi.org/10.1051/0004-6361/202557290 | |
| Published online | 05 June 2026 | |
Self-preservation ice layer mechanisms in mixed CO2–CH4 gas hydrate systems: Implications for icy planetary environments
1
Instituto de Ciencia de Materiales de Sevilla, Universidad de Sevilla – CSIC,
Calle Américo Vespucio 49,
Sevilla
41092,
Spain
2
Universidad de Castilla-La Mancha. Remote Sensing and SIG Group, Regional Development Institute (IDR-UCLM), and Remote Sensing, Agronomy and Irrigation, Associated Unit to CSIC by CIDE, University of Castilla-La Mancha,
02006
Albacete,
Spain
3
Centre of Excellence ENSEMBLE3 Sp. z o. o.,
Wolczynska Str. 133,
01-919
Warsaw,
Poland
4
Department of Material Physics, Research School of Physics, Australian National University,
Mills Road,
Canberra,
ACT
0200,
Australia
5
Wilczek Quantum Center, Shanghai Institute for Advanced Studies,
Shanghai
201315,
China
6
University of Science and Technology of China,
Hefei
230026,
China
7
Instituto de Ciencia de Materiales de Madrid, CSIC,
Calle Sor Juana Ines de la Cruz, 3,
28049
Madrid,
Spain
8
Chemical and Biological Systems Simulation Lab, Centre of New Technologies, University of Warsaw,
Banacha 2C,
02-097
Warsaw,
Poland
★ Corresponding authors: This email address is being protected from spambots. You need JavaScript enabled to view it.
; This email address is being protected from spambots. You need JavaScript enabled to view it.
; This email address is being protected from spambots. You need JavaScript enabled to view it.
Received:
17
September
2025
Accepted:
30
March
2026
Abstract
Aims. Gas hydrates can develop self-preserving ice layers when pre-existing hydrate phases are exposed to near-freezing conditions outside their thermodynamic stability field. We investigated the energetic feasibility and equilibrium thickness of such coatings on mixed CO2–CH4 hydrates under conditions approaching hydrate quadruple-point regimes and assessed their implications for the buoyancy of micron-scale clusters in icy ocean environments.
Methods. We modelled multi-layer hydrate–ice–water systems using Casimir–Lifshitz theory combined with experimental and ab initio dielectric data. Casimir–Lifshitz interaction energies were calculated for hydrate cores with gas-depleted surface regions, and equilibrium ice-layer thicknesses were obtained through Gibbs free-energy minimisation. Cage occupancy was treated parametrically to explore near-surface non-equilibrium states rather than thermodynamic stability domains.
Results. The model predicts energetically favoured self-preserving ice layers for CH4-rich compositions or reduced gas occupancy. These coatings can significantly modify effective density and enable flotation of micron-scale hydrate clusters even at relatively high CO2 fractions, depending on cluster size, composition, and ice-layer thickness.
Conclusions. Self-preserving ice layers sustained by dispersion forces may influence buoyancy and volatile redistribution under near-freezing metastable conditions relevant to some icy ocean environments. The results provide a physically constrained framework for equilibrium ice-layer formation. However, kinetic stability and long-term survival were beyond the scope of this study.
Key words: planets and satellites: composition / planets and satellites: interiors / planets and satellites: oceans
© The Authors 2026
 Open Access article, published by EDP Sciences, under the terms of the Creative Commons Attribution License (https://creativecommons.org/licenses/by/4.0), which permits unrestricted use, distribution, and reproduction in any medium, provided the original work is properly cited.
This article is published in open access under the Subscribe to Open model. This email address is being protected from spambots. You need JavaScript enabled to view it. to support open access publication.
1 Introduction
Gas hydrates (GHs), or clathrates, are crystalline compounds in which gas molecules are encapsulated within a lattice structure of water molecules (Sloan Jr. & Koh 2007; Takeya & Ripmeester 2008). These compounds form under specific temperature and pressure conditions (Sloan Jr. & Koh 2007). They are known to exist or are hypothesised to exist on various celestial bodies (Delsemme 1973; Fonti & Marzo 2010; Mousis et al. 2015), including Earth, other planets such as Mars, and the moons of such gas giants as Saturn and Neptune, including Titan and Triton. Among the gases that can form clathrates, carbon dioxide (CO2) and methane (CH4) are two of the most frequently discussed gases. In this context, Kuiper Belt objects (KBOs)—icy bodies located beyond Neptune’s orbit—are composed of volatile compounds, such as CH4 and potentially CO2. Similarly, trace amounts of these gases are present in the interstellar medium, where gas and dust clouds prevail. Under extremely cold conditions, these molecules can combine to form ices, including mixed CO2–CH4 GHs.
Observations by the Cassini spacecraft have revealed the existence of giant plumes of erupted gases and ice grains emitted via active geysers on the moon Enceladus (Schenk et al. 2018; Khawaja et al. 2025). These plumes, ejected from the outer surface of the moon, originate from a subsurface ocean and contain water, salts, and a variety of volatile and organic compounds derived from the interior (Schenk et al. 2018; Khawaja et al. 2025). One proposed explanation is that GHs play an essential role in forming these plumes and in the chemical composition of the ice layers beneath and within the moon. Gas hydrates hold significant relevance across numerous celestial bodies within our Solar System, prompting questions as to whether they could also be involved in the observed effects on Enceladus. A major unresolved question is whether type-I CO2 and mixed CO2–CH4 hydrate clusters will float or sink in Enceladus-like icy ocean environments, where pressures may approach hydrate quadruple-point conditions. Such flotation offers a pathway for CO2 observed in Enceladus’ plumes (Schenk et al. 2018), with CH4 present in smaller amounts that may originate from hydrothermal reactions at the core-ocean floor boundary, including serpentinisation (Waite et al. 2017) coupled with Fischer–Tropsch-type catalysis (Postberg et al. 2018). As we show here, our results indicate that flotation without ice is restricted to CH4 fractions ≳60%. With stabilising ice layers, buoyancy extends to mixtures containing up to 63% CO2, requiring 10–20% ice by volume for micron-scale particles. Our predictions indicate that a layer of water ice can significantly alter the effective density, and therefore the buoyancy, of GH clusters, a concept that aligns with the findings of Boström et al. (2021). These outcomes highlight a cascade of effects beginning with the microstructure of hydrates: Ice layers and compositional contrasts determine buoyancy, and buoyant particles rise and drive upward flow and volatile redistribution, producing secondary stratification. Such processes may operate on low-gravity ocean worlds where pressures near the ice–ocean interface approach near-quadruple-point conditions, such as Enceladus, where tectonic activity driven by tidal stresses channels volatile transport into plume and geyser activity.
In our previous work (Boström et al. 2021), we predicted that micrometer-sized type-I CO2 hydrate clusters (with 0.01–0.2 μm thick water ice layers) could float in the ocean beneath the ice cap on Enceladus. Notably, variations in the pressures and temperatures of the local environment at different ocean depths could induce leakage of gas molecules via diffusion at the surface region of each cluster. This would establish Casimir–Lifshitz energy equilibrium and induce the formation of ice films at the interface between the GHs and the surrounding water. Clusters with sizes up to a few micrometers, composed of a bulk region of high occupancy (HO) type-I CO2 GHs and a substantial surface region of lower occupancy (i.e. the outer layers of the GH structure, where gas molecules occupy fewer lattice sites compared to the core), can have a thin water ice film. For such systems, it can be argued that large clusters dominated by bulk regions may sink, while other clusters with a thick enough surface region to generate a self-preserving water ice shell have the potential to float. These clusters are then hypothesised to be ejected along with water via geysers into outer space, providing material for the E-ring around Saturn. This ring is known to have a blue colour, in contrast to the red colour of Jupiter’s dusty rings or Saturn’s G-ring, suggesting that particle (ice) clusters in the ring have average sizes on the order of one micrometer (Schenk et al. 2018). Measurements by the Cassini spacecraft, as part of the Cassini-Huygens mission (Schenk et al. 2018), confirmed this particle size range. Importantly, CO2 was found to be one of the most common species, after water, in the plume near the south pole of Enceladus (Schenk et al. 2018). The presence of mixed clathrates in these environments is often inferred based on our understanding of the chemical composition (Schenk et al. 2018) of these celestial bodies and the physical conditions they experience (see also discussions on moon compositions by Castillo-Rogez et al. 2023).
The study of mixed clathrates can provide valuable insights into the geological and climatic history of these celestial bodies and their potential as indicators of habitability or energy resources for future space exploration. Here, we analyse the induced growth of self-preserving ice layers on mixed hydrates, focusing on CO2–CH4 mixed hydrates, where both the induced water ice layer and the presence of lighter CH4 molecules help transport larger GH clusters towards the surface of Enceladus due to the buoyancy variation.
Gas hydrates in natural systems are typically multi-component (Palodkar & Jana 2017) because they form from mixtures of gases (Nna-Mvondo et al. 2021). Pure hydrates, in contrast, are unstable when exposed to other gas types (Delsemme & Swings 1952; Delsemme 1973). The main components of mixed hydrates often include CH4, CO2, N2, and H2S, while minor components can include H2, higher alkanes, Ar, Kr, Xe, SO2, and N2O (Hallbrucker & Mayer 1990; Tegler et al. 2010; Zhdanov et al. 2017).
Experimental work on mixed CO2–CH4 hydrates indicates that all possible mixing ratios of CO2:CH4 can exist within a single mixed hydrate. Notably, CO2 interacts more strongly with the host water framework, which enhances the stability of pure CO2 hydrates relative to CH4 hydrates. This results in slightly smaller lattice parameters for CO2-rich hydrates compared to those primarily composed of CH4 (Qasim et al. 2012; Cladek et al. 2021). Additionally, the rate of GH formation increases as the mole fraction of CO2 increases (Feyzi & Mohebbi 2021). However, in apparent contradiction, Uchida et al. (2005) observed that in mixed CO2 and CH4 systems, CH4 facilitated the formation of GHs, and the first hydrates to form in these mixed gas systems were CH4 rich. Cladek et al. (2021) and other researchers have observed that CO2 can readily replace CH4 in CH4-rich GHs, with methane being released in the process. In their experiments, they investigated the formation of hydrates using pure CO2 and CH4 gases as well as a 1:1 mixture of both gases in the presence of snomax, a protein known to aid in hydrate nucleation. For pure CO2 hydrates, they observed complete cavity filling, meaning that CO2 occupied both the two smaller and six larger cages within the unit cell. In contrast, for pure methane hydrates, only 80% of the available cavities were filled, with methane occupying 73% of the larger cages and 93% of the smaller cages. For mixed CO2–CH4 hydrates, the total cavity filling was around 79%. In this mixture, 8% of the larger cages were filled with CH4 and 77% with CO2, while 54% of the smaller cages were filled with CH4 and 21% with CO2. (For additional information, consult Cladek et al. 2021.)
Observations from those studying methane hydrate mining, storage, transport, and CO2 storage indicate that pure methane hydrates can be depleted of methane through substitution, where CO2 replaces methane. This process leads to CO2 capture and CH4 release (Qasim et al. 2012; Ouyang et al. 2022). Indeed, it has been proposed that methane could be mined from methane hydrates by injecting CO2 into hydrate reservoirs—where CO2 displaces methane, which is then released for extraction as methane-rich gas. The CO2 is sequestered into the methanedepleted hydrates, serving dual purposes: a means of CO2 capture and maintaining the phase integrity of the hydrate, thus preventing mechanical instabilities in overlying rock strata and soils. Similarly, it is important to note that CO2 remains selectively incorporated into the hydrate relative to methane during decomposition (Ohgaki et al. 1996). It was explicitly noted that CH4 in mixed hydrates hinders CO2 removal during decomposition, whereas the presence of CO2 in mixed hydrates favours and accelerates CH4 removal during decomposition. However, in the case of CO2 swapping for methane, this can lead to the trapping of methane by forming CO2-rich hydrate shells around methane hydrate-rich cores.
In this study, we consider GHs to be two-layered structures: a core where the cages are 100% filled with a homogeneous mixture of CH4 and CO2 in varying ratios and an outer gas-depleted layer with varying degrees of cage filling, all less than 100%. Based on experimental observations, the outer hydrate shell is likely richer in CO2 than in CH4. We explore how the self-preservation of mixed CO2–CH4 clathrates occurs by forming submicron-sized ice layers on their surfaces. This self-preservation effect, consistent with our previous studies on isolated CO2 and CH4 clathrates, plays a key role in the buoyancy of these hydrates. The necessary conditions for ice formation on GH surfaces, driven by dispersion forces, are expected to exist on several icy bodies within our Solar System, including moons such as Enceladus. Furthermore, we predict that the mixing ratio between CO2 and CH4 molecules significantly influences the buoyancy of mixed GH clusters, which is particularly relevant to environments such as the subsurface oceans of Enceladus (Schenk et al. 2018).
Our exploration is motivated by observations of GHs in permafrost regions. Until recently, shallow GHs in permafrost regions on Earth were considered unstable. However, Shakhova et al. (2019) and others have found that hydrates are likely stable from 0 to 200 m depth, stabilised by ice layers. The mechanism behind this stability zone has remained unclear. One possible explanation, reported by Takeya & Ripmeester (2008), involves the synthesis of ice-coated, self-preserved hydrate particles, which form through partial degassing of the outer part of a pure GH in an inert gas atmosphere or vacuum during warming. This leads to the conversion of the emptied outer clathrate cells into cubic and then hexagonal ice and eventually anneals to form a continuous ice diffusion barrier on the underlying hydrate particle. In this case, the water for the ice layer originates from the hydrate particle itself.
Under both engineering and natural conditions, some GHs (e.g. CO2 and CH4 clathrates) are stabilised outside their thermodynamic stability window through the formation of an ice layer, a phenomenon known as self-preservation. In this context, self-preservation refers to a metastable regime in which GHs persist outside their strict thermodynamic stability field after partial dissociation, due to the formation of an ice layer at their surface that inhibits further gas release. Laboratory studies have shown that this regime is initiated once pre-existing hydrates are exposed to near-freezing conditions, where dissociation induces internal cooling and rapid crystallisation of water at the hydrate surface. Pavlenko (2021) demonstrated that dissociating hydrates become covered by an ice crust that strongly suppresses further dissociation, while experiments by Burla & Pinnelli (2023) show that CO2 hydrates can remain partially preserved for tens of hours near 268 K due to ice acting as a barrier to gas venting. For CH4 hydrates, Stern et al. (2001, 2003) identified a well-defined self-preservation temperature window between approximately 242 and 275 K, within which dissociation rates decrease sharply once surface ice forms.
A potential explanation for this stabilisation was proposed by the theory of dispersion forces, which uses a new description of the optical responses of ice and water (Boström et al. 2021; Li et al. 2023a,b). Similar models have been used to predict ice nucleation and water condensation on ice nucleation particles in clouds (Luengo-Marquez et al. 2022) and on soil particles (Boström et al. 2023). In the present work, we explicitly assumed the existence of pre-formed hydrates and focused on the physical conditions under which self-preserving ice layers can form and reach equilibrium thickness near the freezing point of water. Using our model, based on dispersion forces, we predict that the growth of an ice layer close to micron-sized scales depends on the presence of surface regions in the GHs with low occupancy (LO) of gas molecules, meaning that the outer layers of the GH contain fewer gas molecules compared to the core. This prediction is consistent with experimentally observed micron-sized self-preservation layers and contrasts with previous water models that suggested no ice layers, or only nanometre-thick layers, for these GHs (Boström et al. 2019). This holds true for the formation of ice layers on GHs in contact with liquid water. Recent work (Li et al. 2023a) has highlighted that ice layers can form through a process known as the ‘dry pathway’ when GHs are in contact with water vapour.
These observations demonstrate that ice layers can strongly inhibit dissociation over laboratory timescales; however, the extrapolation of such effects to geological timescales remains an open kinetic problem. In this non-equilibrium self-preservation regime, near-surface hydrate regions are not expected to satisfy bulk thermodynamic equilibrium constraints, and their local cage occupancy may therefore differ substantially from values predicted from fugacity-based statistical thermodynamic models. The ice can act as an effective barrier to diffusion, depending on microstructure and annealing, as the annealing of common hexagonal ice domains gradually forms a continuous layer. Initially, the ice may start in a cubic phase, but over time, it transitions to a hexagonal phase as stacking faults change. The diffusion barrier strengthens as the stacking faults are reduced during annealing. This process is most effective at temperatures just below 273 K and in low-salinity water (less than 0.5 wt% NaCl), where the freezing point depression of water is minimal. It is known that the freezing point of cold water decreases slightly when salt is added (Hall et al. 1988; Glein et al. 2018). While the surface temperatures of Enceladus are extremely low, the predicted presence of liquid water beneath the ice cap, notably at ~0.05–0.2 M NaCl concentration and basic pH (Postberg et al. 2008, 2009, 2011, 2018; Glein & Waite 2020), suggests that ocean water may have a temperature close to 273 K (Schenk et al. 2018). The estimated water temperature in the ocean on Enceladus is therefore near the quadruple-point temperatures of CH4 and CO2 GHs (Postberg et al. 2008, 2009, 2011, 2018).
Drawing inspiration from the work by Elbaum & Schick (1991a), which highlights the role of intermolecular dispersion forces in ice pre-melting, we investigated how these forces can contribute to the freezing of cold water in the presence of GHs. To explore the influence of these forces on ice formation at the GH-water interfaces, we employed Casimir–Lifshitz theory near quadruple points, where clathrate structures can form at specific temperatures and pressures. We leveraged dielectric functions for the various materials involved–specifically, the electromagnetic spectra for ice, water, and GHs. Our work relies on certain approximations, such as neglecting changes in pH, concentration, and ion-specific double-layer energy (Parsons et al. 2011; Salis et al. 2020; Parsons et al. 2022), due to the unlikely effects of ice layer thickness-dependent surface charges and the surface adsorption of free ions (Thiyam et al. 2018). At the estimated salt concentrations, only minor effects are expected on the dielectric function of water, leading to very small corrections to the predicted ice layer thicknesses.
When computing dispersion forces, another approximation in our model is to treat the GHs as a multi-layered system rather than as closed or spherical particles since the layered description captures the relevant dielectric response without the added complexity of curved geometries. This allows us to analyse a four-layer configuration, as depicted in Fig. 1, consisting of water, ice, and GHs with both LO and HO regions.
As discussed by Boström et al. (2021), LO regions are likely to emerge near the ice surface as a result of gas diffusion through the ice. In this framework, the equilibrium thickness of the self-preserved ice layer is set by the balance of Casimir–Lifshitz forces within the layered structure: repulsion dominates at short separations, corresponding to thin ice layers, whereas attraction prevails at larger separations, corresponding to thicker ice layers. A similar balance of dispersion forces also governs the behaviour of levitating photonic structures, where related mechanisms have been used to realize photonic resonators (Esteso et al. 2015; Zhao et al. 2019; Esteso et al. 2019, 2024). Interfaces involving lattice mismatch are likewise common, whether between different GHs, GHs of different densities, or between water ice and the GH itself (Boström et al. 2021).
In the following sections, we present the theoretical expressions required for Gibbs free-energy calculations within the Casimir–Lifshitz theory framework and explore the intricacies of modelling dielectric functions for these various materials. We also describe the assumptions adopted for the multilayer systems considered in this work.
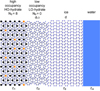 |
Fig. 1 Schematic diagram of the four-layer mixed CO2–CH4 hydrate system: HO mixed GH (characterised by ε1), LO mixed GH (ε2), pure H2O ice (ε3), and pure liquid H2O (ε4). The thicknesses of the LO mixed-hydrate region and the ice layer are denoted by dLO and d, respectively. Black and orange dots in the HO layer indicate CO2 and CH4 molecules, respectively, distributed within the hydrate lattice. We have chosen to show HO with Ng = NCO2 + NCH4 = 8 and LO with Ng = 0 in this figure. |
2 Methods
2.1 Casimir–Lifshitz interaction in multi-layer systems
In this study we calculated the Casimir–Lifshitz interaction free energy within a multi-layer system. The Casimir–Lifshitz free energy density per unit area, F(d), at a finite temperature, T, is given by the following expression (Ellingsen 2007; Esteso et al. 2020; Boström et al. 2021):
![Mathematical equation: $\[F(d)=\frac{k_{\mathrm{B}} T}{2 \pi} \sum_{m=0}^{\infty} \int_0^{\prime} \mathrm{d} k^{\|} k^{\|} \sum_{\sigma=\mathrm{TE}, \mathrm{TM}} \ln \left[1-\tilde{r}_\sigma^{32} r_\sigma^{34} \mathrm{e}^{-2 k_3^{\perp} d}\right],\]$](/articles/aa/full_html/2026/06/aa57290-25/aa57290-25-eq1.png) (1)
(1)
where d is the ice thickness (see Fig. 1), k∥ is the component of the wave vector ![Mathematical equation: $\[\mathbf{k}=(2 \pi / \lambda) \hat{\mathbf{k}}\]$](/articles/aa/full_html/2026/06/aa57290-25/aa57290-25-eq2.png) parallel to the surface, and
parallel to the surface, and ![Mathematical equation: $\[\kappa_{i}^{\perp}=\sqrt{k^{\|^{2}+\varepsilon_{i} \xi_{m}^{2} / c^{2}}}\]$](/articles/aa/full_html/2026/06/aa57290-25/aa57290-25-eq3.png) is the perpendicular wave vector in layer i (i = 1, . . ., 4). Here, ξm = m 2πkBT/ℏ represents the Matsubara frequencies, where m is the Matsubara index, kB the Boltzmann constant, ℏ the reduced Planck constant, and c the speed of light. The ‘prime’ in the summation indicates that the term for m = 0 is weighted by a factor 1/2. The summation runs over the two polarisation modes, transverse electric (σ =TE) and transverse magnetic (σ =TM). Multiple reflections between the interfaces in the multi-layer system were accounted for by introducing an effective reflection coefficient,
is the perpendicular wave vector in layer i (i = 1, . . ., 4). Here, ξm = m 2πkBT/ℏ represents the Matsubara frequencies, where m is the Matsubara index, kB the Boltzmann constant, ℏ the reduced Planck constant, and c the speed of light. The ‘prime’ in the summation indicates that the term for m = 0 is weighted by a factor 1/2. The summation runs over the two polarisation modes, transverse electric (σ =TE) and transverse magnetic (σ =TM). Multiple reflections between the interfaces in the multi-layer system were accounted for by introducing an effective reflection coefficient, ![Mathematical equation: $\[\tilde{r}_{\sigma}^{32}\]$](/articles/aa/full_html/2026/06/aa57290-25/aa57290-25-eq4.png) , given by (Buhmann 2012; Ellingsen 2007)
, given by (Buhmann 2012; Ellingsen 2007)
![Mathematical equation: $\[\tilde{r}_\sigma^{32}=\frac{r_\sigma^{32}+r_\sigma^{21} \mathrm{e}^{-2 \kappa_2^{\perp} d_{\mathrm{LO}}}}{1+r_\sigma^{32} r_\sigma^{21} \mathrm{e}^{-2 \kappa_2^{\perp} d_{\mathrm{LO}}}}.\]$](/articles/aa/full_html/2026/06/aa57290-25/aa57290-25-eq5.png) (2)
(2)
Here, dLO is the thickness of the LO layer, and ![Mathematical equation: $\[r_{\sigma}^{i j}\]$](/articles/aa/full_html/2026/06/aa57290-25/aa57290-25-eq6.png) represents the Fresnel reflection coefficients that describe the reflection of a photon between medium i and medium j. These coefficients depend on the polarisation mode and can be expressed as
represents the Fresnel reflection coefficients that describe the reflection of a photon between medium i and medium j. These coefficients depend on the polarisation mode and can be expressed as
![Mathematical equation: $\[r_{\mathrm{TE}}^{i j}=\frac{\kappa_i^{\perp}-\kappa_j^{\perp}}{\kappa_i^{\perp}+\kappa_j^{\perp}}, \quad r_{\mathrm{TM}}^{i j}=\frac{\varepsilon_j \kappa_i^{\perp}-\varepsilon_i \kappa_j^{\perp}}{\varepsilon_j \kappa_i^{\perp}+\varepsilon_i \kappa_j^{\perp}}.\]$](/articles/aa/full_html/2026/06/aa57290-25/aa57290-25-eq7.png) (3)
(3)
Note that in all of these expressions, the permittivity from a medium i is evaluated at the mth Matsubara frequency and is given by
![Mathematical equation: $\[\varepsilon_i \equiv \varepsilon_i\left(i \xi_m\right)=1+\frac{2}{\pi} \int_0^{\infty} \mathrm{d} \omega \frac{\omega \varepsilon_i^{\prime \prime}(\omega)}{\omega^2+\xi_m^2},\]$](/articles/aa/full_html/2026/06/aa57290-25/aa57290-25-eq8.png) (4)
(4)
where ![Mathematical equation: $\[\varepsilon_{i}^{\prime \prime}(\omega)\]$](/articles/aa/full_html/2026/06/aa57290-25/aa57290-25-eq9.png) represents the imaginary part of the complex permittivity,
represents the imaginary part of the complex permittivity, ![Mathematical equation: $\[\varepsilon_{i}(\omega)=\varepsilon_{i}^{\prime}(\omega)+i \varepsilon_{i}^{\prime \prime}(\omega)\]$](/articles/aa/full_html/2026/06/aa57290-25/aa57290-25-eq10.png) .
.
This comprehensive framework accounts for the intricate interplay of various factors in the calculation of the Casimir–Lifshitz interaction free energy within multi-layered structures. In the next steps of our work, we applied this framework to calculate the Casimir–Lifshitz free energy for a specific four-layer system, consisting of consecutive layers of water, ice, and GHs with varying compositions, as shown in Fig. 1. These GH structures are characterised by the occupancy of gas molecules within their water lattice, quantified by Ng—the total number of gas molecules per 46 water molecules in the hydrate unit cell. This occupancy, defined as Ng = NCO2 + NCH4 in our system, ranges from zero (completely empty cages) to eight (fully occupied), and accounts for different CO2–CH4 mixing ratios. We aim to understand how these materials interact and how the self-preservation of ice layers influences the stability and buoyancy of the GHs. In this sense, cage occupancy is treated as a parametric variable, rather than as a quantity predicted from gas fugacity, pressure, temperature, or composition. We therefore did not attempt to determine which occupancies are realised under thermodynamic equilibrium conditions, nor to map hydrate stability domains using statistical thermodynamic models such as the van der Waals–Platteeuw framework. Instead, we use this parametric approach to explore how locally reduced occupancy in near-surface hydrate regions–arising from partial dissociation, gas diffusion, or other non-equilibrium effects characteristic of the self-preservation regime-affects the equilibrium thickness of ice layers predicted by Casimir–Lifshitz theory, without assigning thermodynamic stability to all occupancies considered.
To proceed with this analysis, we first modelled the dielectric functions of the materials involved, which are required for calculating the interaction energy within the Casimir–Lifshitz framework. These functions determine the magnitude and sign of the dispersion forces in the system.
2.2 Materials modelling
2.2.1 Mass density of a layered gas hydrate cluster in cold ocean water
Key physical properties of GHs are strongly influenced by the occupancy of gas molecules within the water lattice, Ng. To calculate the number densities of gas molecules (nM) and water molecules (nwh) in GHs, we use the relation: nM = (Ng × nwh)/46. Here, nwh denotes the number density of water molecules in the hydrate lattice, with a typical value of 2.657 × 10⁻²Å−3. For comparison, the number density of water molecules in pure ice is slightly higher, nice = 3.064 × 10⁻²Å−3, corresponding to a mass density of 0.9167 g/cm3 (Lide 2005). Table 1 summarises the key numerical values used in our model. Notably, changes in gas occupancy, whether through absorption or release, modify the dielectric response of the hydrate. These variations in dielectric properties lead to distinct physical behaviours, which are analysed in detail in the following sections.
Fully occupied CH4 hydrate clusters are predicted to float, while fully occupied CO2 hydrates are expected to sink. For mixed GHs, the relationship between composition and buoyancy becomes more complex. Buoyancy depends sensitively on the specific CH4–CO2 ratio and must therefore be evaluated through detailed numerical modelling. A key point of interest is the critical threshold of CH4 gas molecules within GH clusters, beyond which they will float in water, matching the mass densities expected for the ocean water on Enceladus. This is particularly relevant given that the density of Enceladus’ ocean water has been estimated to be around 1.003 g/cm3 by Safi et al. (2017) and approximately 1.03 g/cm3 by Bouquet et al. (2015).
We proceed to examine the impact of finite particle size on the buoyancy of GH clusters. As in Boström et al. (2021), we model the hydrate particle as a spherical structure with a HO core and a LO surface region, coated by a self-preserving ice layer. The analytical expressions used to compute the average density ρav of such layered particles are derived explicitly in Appendix A. The average density of the ice-coated GH cluster is given by
![Mathematical equation: $\[\rho_{\mathrm{av}}=\frac{\rho_{\mathrm{h}} r_{\mathrm{h}}^3+\rho_{\mathrm{i}}\left[\left(r_{\mathrm{h}}+d\right)^3-r_{\mathrm{h}}^3\right]}{\left(r_{\mathrm{h}}+d\right)^3},\]$](/articles/aa/full_html/2026/06/aa57290-25/aa57290-25-eq11.png) (5)
(5)
where ρh is the average mass density of the layered GH, consisting of the HO core and the LO surface region. Here, rh is the total radius of the GH particle, d is the thickness of the ice layer, and ρice is the density of the pure ice. The radius of the HO core is defined as rc = rh − dLO, where dLO is the average thickness of the LO surface region.
The density of the mixed GH particle, including both a HO and a LO region, ρh, is given by
![Mathematical equation: $\[\rho_{\mathrm{h}}=\frac{\rho_{\mathrm{HO}} r_c^3+\rho_{\mathrm{LO}}\left[r_{\mathrm{h}}^3-r_c^3\right]}{r_{\mathrm{h}}^3},\]$](/articles/aa/full_html/2026/06/aa57290-25/aa57290-25-eq12.png) (6)
(6)
where ρHO and ρLO are the densities of the HO core and LO surface region, respectively.
In this study we explore the conditions under which composite clusters, consisting of a HO core, a LO surface region due to gas diffusion, and potentially an external ice layer, will float or sink in various ocean environments. For the particle to float, its average density (ρav) must be lower than that of the surrounding liquid water.
Guest-molecule number density in CO2–CH4 GHs.
2.2.2 Dielectric permittivity of water and ice
In our analysis, we relied on the parametrised dielectric functions for ice and water developed by MacDowell and collaborators (Luengo-Márquez & MacDowell 2021; Luengo-Marquez et al. 2022). These parametrisations reproduce the available experimental data along most of the real frequency axis with very good accuracy, but they do not satisfy the Kramers–Kronig relations and are not reliable in the region surrounding zero frequency. In contrast, the model of Fiedler et al. (2020), which is based on ab initio calculations, is fully consistent with Kramers–Kronig and provides a reliable description of both the static dielectric constant and the full spectral range, although it reproduces the experimental data less accurately overall. For this reason, in our analysis of the Casimir–Lifshitz free energy very close to the triple point of water, T = 273.16 K, we combined the two approaches, taking advantage of the strengths of each: the parametrisations of Luengo-Marquez et al. (2022) for most of the spectral range, and the Fiedler model (Fiedler et al. 2020) to constrain the zero-frequency limit, as shown in Fig. 2. It is worth noting that this temperature closely aligns with the quadruple points of CH4 and CO2 hydrates, as we explore in the following sections.
2.2.3 Permittivity of mixed hydrates of diverse occupancy
Other materials to be modelled within the four-layer structure are mixed CO2–CH4 GHs with different gas molecular occupancies. At specific temperatures and pressures, known as quadruple points, clathrate structures can form when gas molecules are present in ice-cold water (Dickens & Quinby-Hunt 1994). The quadruple point of pure CH4 hydrate, very close to the triple point of water, occurs at about T = 272.9 K and p = 25.63 bar (Sloan Jr. & Koh 2007). Similarly, the quadruple point of pure CO2 hydrate is at around T = 273.1 K and p = 12.56 bar (Sloan Jr. & Koh 2007). Away from the quadruple points, additional thermodynamic effects must be considered for future studies. All systems discussed here are considered to be very near or at the triple point of water. As in (Boström et al. 2019, 2021; Li et al. 2023b,a), we modelled the dielectric function of GHs (εgh(iξm)) using the Lorentz-Lorenz model (Aspnes 1982), with a mixing scheme for each GH structure as proposed by Bonnefoy et al. (Bonnefoy et al. 2005a,b),
![Mathematical equation: $\[\varepsilon_{\mathrm{gh}}(i \xi_m)=\frac{1+2 \Gamma(i \xi_m)}{1-\Gamma(i \xi_m)},\]$](/articles/aa/full_html/2026/06/aa57290-25/aa57290-25-eq13.png) (7)
(7)
where Γ(iξm) is expressed in terms of the effective ice permittivity and the polarizabilities of the guest molecules:
![Mathematical equation: $\[\Gamma(i \xi_m)=\frac{\varepsilon_3(i \xi_m)-1}{\varepsilon_3(i \xi_m)+2}(\frac{n_{\mathrm{wh}}}{n_{\mathrm{ice}}})+\frac{4 \pi}{3}[\alpha_{\mathrm{M}}^{\mathrm{CH}_4}(i \xi_m) n_{\mathrm{M}}^{\mathrm{CH}_4}+\alpha_{\mathrm{M}}^{\mathrm{CO}_2}(i \xi_m) n_{\mathrm{M}}^{\mathrm{CO}_2}].\]$](/articles/aa/full_html/2026/06/aa57290-25/aa57290-25-eq14.png) (8)
(8)
Quantum-chemical calculations provide the dynamic molecular polarizabilities, αM(iξm), at discrete frequencies. These can be represented at arbitrary imaginary frequencies by fitting to a multi-oscillator model:
![Mathematical equation: $\[\alpha_{\mathrm{M}}(i \xi_m)=\sum_j \frac{\alpha_j}{1+(\xi_m / \omega_j)^2}.\]$](/articles/aa/full_html/2026/06/aa57290-25/aa57290-25-eq15.png) (9)
(9)
A five-oscillator fit (j = 5, in the above expression), as performed by Parsons, reproduces the dynamic polarizability with a relative error below 0.02% (Parsons & Ninham 2010). The adjusted parameters for CH4 and CO2 in this model are given in Fiedler et al. (2017). Thus, the dielectric function of GHs is determined by (i) the effective ice permittivity, scaled by the density ratio nwh/nice, and (ii) the gas-molecule polarizabilities, weighted by the corresponding number densities (Fiedler et al. 2017). Examples of mixed-hydrate permittivities obtained with this model are shown in Fig. 2.
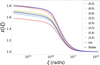 |
Fig. 2 Dielectric functions at T = 273.16 K, evaluated at imaginary frequencies, for different materials: water and ice from Luengo-Marquez et al. (2022) – Table IV for water and Table VI for Ice. We show LO GHs (Ng = 0), and HO mixed CO2–CH4 GHs (Ng = 8). Various mixed compositions of CO2 and CH4 are considered (NCO2, NCH4). Here, Ng = NCO2 + NCH4 represents the number of gas molecules per 46 water molecules in the GH structures, with values between zero and eight. The static values used to ε(0) are 91.5 for ice (Elbaum & Schick 1991b), 87.8 for water (model from Fiedler et al. 2020), and 17.7 for the empty GH structure (Ng = 0). For the HO mixed GHs, we take 24.4 and 25.5 for the fully occupied structure (Ng = 8) with CO2 or CH4, respectively. |
3 Results
3.1 Buoyancy of partially occupied mixed gas hydrate clusters
Figure 3 shows the mass density of bulk homogeneous mixed CO2–CH4 GHs as a function of the number of CO2 molecules per unit cell (NCO2), with different colours indicating the number of CH4 molecules (NCH4). As the figure illustrates, the behaviour of GHs in terms of buoyancy strongly depends on their gas composition, which in turn affects their mass density. GHs composed entirely of CO2 molecules (NCO2 = 8) tend to have a higher mass density and, as a result, they typically sink. Conversely, GHs consisting entirely of CH4 molecules (NCO2 = 0) exhibit a lower mass density, causing them to float in water.
For GHs with mixed compositions, where the number of CO2 gas molecules lies between these extremes, the buoyancy is mainly determined by the CO2 content. Gas Hydrates with a low CO2 occupancy (NCO2 ≤ 3) are more likely to float, regardless of the CH4 content in the structure. This is because the lower CO2 occupancy leads to a lower overall mass density that favours buoyancy.
However, as the proportion of CO2 gas molecules increases within the mixed hydrate structure, the overall mass density of the GHs rises, potentially matching or even surpassing that of liquid water. On Enceladus, where the density of water ranges from 1.003 g/cm3 to 1.03 g/cm3 (depending on the source), marked with horizontal dotted lines in the figure, GHs with a higher CO2 content may sink. Notably, GHs with low CH4 content may still float under specific conditions. For these GHs to float, the following requirements must be met: the GH clusters must be relatively small, and a self-preserving ice layer must form on their outer surface, which we explore further in the next sections. The results shown in this figure support the predictions by Courville et al. (2023) that mixed hydrates may drive CO2 transport to the surface of Enceladus’ ocean. Our results indicate that flotation without ice is restricted to CH4 fractions ≳60%. With stabilising ice layers, buoyancy extends to mixtures containing up to 63% CO2, requiring 10–20% ice by volume for micron-scale particles, decreasing to only a few percent for particles larger than ~10 μm.
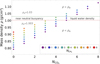 |
Fig. 3 Mass density of bulk homogeneous mixed CO2–CH4 hydrates as a function of the number of CO2 molecules per unit cell (NCO2). Different colours indicate varying numbers of CH4 molecules (NCH4). The dotted horizontal lines represent the estimated range of ocean water density on Enceladus (~1.003–1.03 g/cm3; Safi et al. 2017; Bouquet et al. 2015). The data are derived in the appendix and taken from Table A.1. |
3.2 Formation of self-preservation ice layers and their impact on buoyancy
The formation of self-preserving ice layers is a critical factor that can drastically alter the buoyancy predictions for GHs. These ice layers, driven by Casimir–Lifshitz dispersion forces, lead to different buoyancy behaviours than those predicted solely by the gas composition. To better understand this phenomenon, we examined two distinct configurations: a three-layer system composed of water, ice, and mixed GHs and a four-layer system that includes a gas-depleted LO region between the hydrate and the ice. These setups allowed us to study how variations in gas composition influence the formation of a stabilising ice layer, and how this, in turn, affects the buoyancy of the GH clusters.
Figure 4 reveals that, for a three-layer mixed GHs-ice-water system, the formation of self-preserving ice layers depends on the total occupancy of gas molecules. Specifically, the total number of gas molecules (Ng = NCO2 + NCH4) influences the thickness of the ice layer formed through the Casimir–Lifshitz free energy. Systems with NCO2 + NCH4 = 2 and NCO2 + NCH4 = 3 exhibit ice thicknesses of approximately 140 nm and 70 nm, respectively. These results suggest that as the total gas occupancy increases, the ice layers formed are thinner, which may impact their stability and buoyancy. We stress that while the ice layer thicknesses become thicker when occupancy decreases, the energy minima become shallower. This means that lower occupancies lead to thicker equilibrium ice layers, but these layers are less energetically favoured, since the system is more easily destabilised by fluctuations. As noted in Sect. 2.1, occupancy is treated parametrically here, and these trends do not imply that the corresponding occupancies are necessarily realised or thermodynamically stable under a given fugacity-controlled state.
For systems with NCO2 + NCH4 ≥ 4, the Casimir–Lifshitz energy does not show a minimum as a function of distance for the HO–ice–water interaction, regardless of the CO2–CH4 ratio. This is because the dielectric functions of these HO GHs do not fall within the dielectric contrast window defined by those of water and ice, as illustrated in Fig. 2. As a result, no self-preserving ice layer is expected to form for these compositions. Consequently, the corresponding GHs shown in Fig. 3 are not expected to float if they fall outside the buoyancy limits defined by Courville et al. (2023). The presence of a self-preserving ice layer, which is strongly influenced by the gas composition, plays a critical role in determining the buoyancy of mixed GH clusters. For a three-layer system, lower total gas occupancy correlates with thicker and less energetically favoured ice layers, while higher occupancy leads to thinner ice layers and potentially a loss of buoyancy.
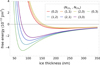 |
Fig. 4 Casimir–Lifshitz free energy in a three-layered system consisting of mixed CO2–CH4 GHs-ice-water as a function of ice layer thickness. Systems correspond to combinations of NCO2 + NCH4 = 2 and NCO2 + NCH4 = 3. The minimum of each curve indicates the predicted self-preserving ice thickness at equilibrium, d. |
3.3 Buoyancy of layered mixed gas hydrate clusters
The presence of a LO surface region between the ice layer and the HO core leads to an increase in the equilibrium thickness of the self-preserving ice, thereby enhancing the buoyancy of GHs. This effect is particularly significant when CO2 molecules occupy the clathrate structure (Boström et al. 2021). These systems can thus be described as multi-layered materials, each layer being characterised by its own dielectric function.
In Fig. 5 the Casimir–Lifshitz free energy for a four-layer system composed of mixed CO2–CH4 hydrates in contact with ice–water is plotted as a function of ice layer thickness. In these calculations, the LO layer is kept empty (Ng = 0), while the composition of the HO surface region is varied. The representative case of NCO2 = 5 is chosen based on theoretical considerations, as it represents a balanced scenario for mixed GHs: The proportion of CO2 is sufficiently high to influence ice-layer formation while leaving enough room for CH4 occupancy to sustain buoyancy effects. A value of dLO = 50 nm was chosen, as it provides a sufficiently thick depletion layer to influence the interaction energy while allowing a clear assessment of the effect of HO region composition. As before, the free energy profiles for different mixed GHs exhibit distinct minima, which correspond to the energetically favoured ice layer thicknesses. Hydrates with a lower CH4 content, and thus a lower total gas molecule occupancy, tend to form thicker ice layers, which reduce the overall mass density of the hydrate clusters, resulting in enhanced buoyancy and allowing the hydrate clusters to float in water. This is because the ice acts as an insulating layer, which reduces the effective mass density of the entire hydrate cluster. In contrast, mixed hydrates with a higher total gas molecule occupancy form thinner ice layers, resulting in less insulation of the hydrate core, thus leading to a higher mass density, especially at high concentrations of CO2 molecules, and the tendency for these clusters to sink. Figure 6 further illustrates this concept by comparing mixed GHs with LO regions (Ng = 0) and fully occupied HO regions (Ng = 8), each with varying CO2–CH4 ratios. The formation of ice layers on these hydrate surfaces differs slightly as a result of the ratio of CH4 to CO2 in the clathrate structure. However, this is less important than the effect varying this ratio has on the density of the core region.
In Figs. 7 and 8, we explore how variations in the composition and thickness of the LO GH layer affect the stability and equilibrium thickness of the self-preserving ice layer. Figure 7 shows that, for a fixed LO layer thickness of dLO = 50 nm, increasing gas occupancy in the LO region leads to more energetically favoured ice formation, as indicated by deeper minima in the Casimir–Lifshitz free energy profiles. The results also show that for LO regions with Ng = 1 or 2, the equilibrium ice thickness depends more strongly on the total gas occupancy than on the specific gas species. This dependence becomes less pronounced at Ng = 3. In Fig. 8 we consider a system with Ng = 0 in the LO region and Ng = 8 (CO2-filled) in the HO region. The plot illustrates that the inclusion of a gas-depleted LO layer significantly enhances the stability of the ice layer, with the equilibrium thickness varying as a function of the LO layer thickness. This behaviour is consistent with the findings reported by Boström et al. (2021).
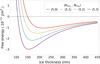 |
Fig. 5 Casimir–Lifshitz free energy in a four-layered system consisting of mixed CO2–CH4 GHs (HO–LO–ice–water) as a function of ice layer thickness. In the HO surface region, the composition varies with NCO2 = 5 and NCH4 = 0–3. The LO layer is empty, and its thickness is fixed at dLO = 50 nm. |
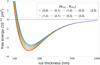 |
Fig. 6 Casimir–Lifshitz free energy in a four-layered system consisting of mixed CO2–CH4 GHs (HO–LO–ice–water) as a function of ice layer thickness. The total HO hydrate layer is fixed at Ng = 8, while the LO surface region is taken as empty (Ng = 0). Consequently, the HO core contains the full occupancy, with its CO2–CH4 composition varied. The LO layer thickness is fixed at dLO = 50 nm. |
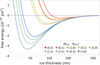 |
Fig. 7 Casimir–Lifshitz free energy in a four-layered system consisting of mixed CO2–CH4 GHs (HO–LO–ice–water) as a function of ice layer thickness. The systems correspond to a total HO region occupancy of NCO2 = 8. The LO layer thickness is fixed at dLO = 50 nm, with Ng varying from zero to three. |
3.4 Size dependence of buoyancy of mixed gas hydrate clusters
In Fig. 9, we investigate effective density of mixed GH particles as a function of rh for different thicknesses of the LO layer given in Table 2. We study the specific example of a fully occupied (NCO2 = 4, NCH4 = 4) clathrate structure. This analysis was carried out using the values of ρHO provided in Table A.1, along with different LO layer thicknesses from Table 2, and applying Eq. (5). The points where the effective density curves intersect the water density line indicate approximate size thresholds for hydrate particles transitioning from floating to sinking due to changes in average density. In Figs. 10 and 11, we examine the effective density of CO2 hydrate particles as a function of rh for fixed thicknesses of the outer LO layer, dLO = 10 nm and dLO = 40 nm, respectively, using the thickness of the ice layer (given in Table 2) in Eq. (5). These values for the thickness of the LO layers were selected to illustrate how the general trends will vary under different experimental conditions. An increase in the thickness of the LO region enhances the buoyancy of larger particles, promoting their flotation. Additionally, for a fixed total gas occupancy, a higher CH4-to-CO2 ratio further enhances flotation, allowing larger hydrate clusters to rise towards the surface.
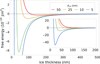 |
Fig. 8 Casimir–Lifshitz free energy in a four-layered system consisting of mixed CO2–CH4 GHs (HO–LO–ice–water) as a function of ice layer thickness. The systems correspond to a total occupancy in the HO region of NCO2 = 8 and a surface region with Ng = 0. The LO region thickness, dLO, is varied from 5 to 50 nm. |
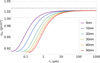 |
Fig. 9 Effective density of CO2 hydrate particles as a function of radius rh for different thicknesses of the outer LO layer (dLO). Details are given in Table 2. For comparison, a dashed and a dashed-dotted horizontal line representing densities for the ocean water on Enceladus, such as 1.003 g/cm3 and 1.03 g/cm3 reported in Safi et al. (2017) and Bouquet et al. (2015), respectively, are included. |
4 Discussion
The results of this study provide important insights into the buoyancy properties of GH particles ranging in size from sub-micrometers to hundreds of micrometers, with particular emphasis on how gas composition, occupancy levels, and the formation of self-preserving ice layers affect buoyancy. Our results help clarify the buoyancy properties of mixed CO2–CH4 hydrates under near-quadruple-point conditions, showing that such hydrates can remain buoyant up to 63% CO2 with 10–20% ice by volume at micron scales. These factors have important implications for understanding the behaviour of GHs in environments such as Enceladus and other low-gravity ocean worlds where pressure–temperature conditions approach hydrate quadruple-point regimes. For Pluto, however, these results are not directly applicable at the ice–ocean interface, because hydrostatic pressures there are expected to exceed clathrate quadruple-point pressures by orders of magnitude. Instead, previous studies have discussed clathrates in the context of long-term ocean insulation. Kamata et al. (2019) proposed that a CH4 hydrate layer beneath Pluto’s ice shell could act as a thermal and mechanical insulator, owing to the relatively low thermal conductivity and high viscosity of hydrates compared with ice. Thus, while tectonic activity on Enceladus disrupts global shells and channels buoyant hydrates into volatile transport and geyser activity, Pluto’s structurally stable outer shell may instead allow continuous clathrate sheets to develop, which help preserve its ocean over geological timescales (Nimmo et al. 2016; Kamata et al. 2019).
In our analysis, we first examine systems with a fixed total of eight gas molecules per unit cell (Ng = NCO2 + NCH4 = 8), where the relative amounts of CO2 and CH4 are varied. The results, illustrated in earlier figures, show that GHs composed entirely of CO2 molecules (i.e. NCO2 = 8) tend to sink due to their higher mass density, whereas GHs made solely of CH4 molecules (NCO2 = 0) typically float, owing to their lower mass density. Mixed CO2–CH4 GHs display intermediate buoyancy, with the proportion of CO2 molecules being the critical factor. Specifically, GHs with low CO2 occupancy (NCO2 ≤ 3) maintain buoyancy regardless of the amount of CH4 present.
As the CO2 content in the hydrate structure increases, the overall mass density of mixed GHs approaches or exceeds that of liquid water, particularly in environments such as Enceladus, where the density of liquid water ranges from 1.003 g/cm3 to 1.03 g/cm3 (Safi et al. 2017; Bouquet et al. 2015). This finding reinforces an important conclusion: GHs with low CH4 content can still float under certain conditions, but a self-preserving ice layer is crucial for buoyancy. This ice layer, which forms on the surface of GH clusters, plays a vital role in reducing the overall density of the system and enabling flotation. These results emphasise the importance of gas composition, grain size, shell geometry, and self-preservation processes in determining the buoyancy and stability of GHs over time.
Building on the previous analysis, we further investigate the role of the self-preserving ice layer, which forms as a result of Casimir–Lifshitz dispersion forces. The simulations here presented are first performed for a three-layer system composed of water, ice, and mixed GHs. Our results show that the equilibrium ice layer thickness depends strongly on the total gas occupancy in the hydrate. Specifically, for systems with NCO2 + NCH4 = 2 and 3 (see Fig. 4), the ice layer reaches approximately 140 nm and 70 nm, respectively. These findings indicate that lower total gas occupancy leads to thicker ice layers, which can enhance buoyancy but may reduce mechanical stability. In the extreme case of NCO2 + NCH4 = 0, the Casimir–Lifshitz energy profile exhibits a minimum at 265 nm, corresponding to a substantially thicker ice layer. However, as the CO2 content increases, this effect becomes less pronounced. In particular, for systems with NCO2 ≥ 4, no energy minimum is observed, indicating that self-preserving ice layers do not form under those conditions. These results suggest that the formation of stabilising ice layers is restricted to GHs with an occupancy that is sufficiently low.
We then extend our analysis to a more complex four-layer system, comprising water, ice, mixed GHs, and including their LO surface regions. The results from this extended model reveal how these LO regions, formed by gas diffusion, influence the buoyancy of the hydrate particles. The formation of a self-preserving ice layer is shown to be essential for GHs to float, and the thickness of this ice layer can vary depending on the composition of the GHs and the amount of gas molecules in the LO surface region. This extended model provides a more comprehensive picture of how GHs might behave in low-gravity ocean worlds where pressures near the ice–ocean interface approach hydrate quadruple-point conditions, such as Enceladus.
Our model supports the hypothesis proposed by Waite et al. (2017) and Schenk et al. (2018) that self-preserving CO2–CH4 hydrates could float beneath Enceladus’ icy shell, contributing to the observed plumes. The CO2 stored in these hydrates would be released upon destabilisation, contributing to the gas plumes. Our findings suggest that buoyant GHs could rise to the surface, destabilise, and trigger gas release, which could help explain the continuous out gassing of CO2 from Enceladus’ South Pole region.
The size of water-ice particles in Saturn’s E-ring, typically around 1 micron (Pang et al. 1984; Showalter et al. 1991; Hamilton & Burns 1994), aligns with the predicted size of ice-coated GHs ejected from Enceladus’ ocean. This further supports the idea that buoyant, ice-coated GHs could contribute to the formation of the E-ring, as previously suggested by Hillier et al. (2007), Postberg et al. (2008), and Catling & Kasting (2017). However, long-term dynamics must also be considered. Over geological timescales, temperature fluctuations, pressure changes, and chemical diffusion could alter the stability of the ice layer and, consequently, the buoyancy of GHs. For instance, temperature and pressure fluctuations within the ocean could cause the ice layer to melt or thin, destabilising the hydrate clusters.
Additionally, our model suggests that self-preserving CO2–CH4 hydrates may affect the thermal behaviour of their surrounding environment under near-freezing conditions. By forming ice coatings, these hydrates can reduce heat exchange locally and contribute to delaying freezing, although their longterm persistence cannot be assessed without explicit kinetic modelling. As such, any stabilising effect should be understood as local and time-limited rather than indicative of sustained or global insulation.
These processes may therefore play a role in subsurface environments of low-gravity ocean worlds where pressure–temperature conditions approach the hydrate quadruple point, without implying applicability to large ocean worlds. In such settings, buoyant hydrates may also influence volatile transport and contribute to geological activity as they migrate through the ice–ocean system.
These findings, together with extended coupled kinetictransport studies, not only contribute to understanding the immediate buoyancy behaviour of mixed GHs but also provide insight into their potential role in carbon cycling and thermal processes in these environments. Stabilised hydrates, being richer in CO2 than dissolved gases in the surrounding water, could contribute to the carbon cycle of such systems. This has implications for the geochemistry and thermal evolution of bodies such as Enceladus, where GHs may regulate volatile substances beneath the icy surfaces.
Equilibrium self-preserving ice thickness for varying LO-layer thickness.
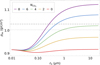 |
Fig. 10 Effective density of CO2 hydrate particles as a function of radius rh for a fixed value of thicknesses of the outer LO layer, dLO = 10 nm. Details are given in Table 2. For comparison, a dashed and dashed-dotted line have been included. These lines represent densities for the ocean water on Enceladus, such as 1.003 g/cm3 and 1.03 g/cm3 reported in Safi et al. (2017), and Bouquet et al. (2015), respectively. |
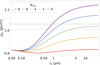 |
Fig. 11 Effective density of CO2 hydrate particles as a function of radius rh for a fixed value of thicknesses of the outer LO layer, dLO = 40 nm. Details are given in Table 2. For comparison, a dashed and dashed-dotted line have been included. These lines represent densities for the ocean water on Enceladus, such as 1.003 g/cm3 and 1.03 g/cm3 reported in Safi et al. (2017), and Bouquet et al. (2015), respectively. |
4.1 Scope and limitations
Our calculations address the energetic feasibility and equilibrium thickness of self-preserving ice layers, but they do not predict dissociation times or hydrate survival durations. Below the hydrate quadruple point, hydrates are thermodynamically unstable and survival becomes diffusion-controlled. In particular, the persistence of micron-sized hydrate grains coated by nanometre-to sub-micrometre-thick ice layers over geologically relevant timescales cannot be inferred without explicit kinetic modelling of coupled gas diffusion through ice and hydrate dissociation. Moreover, the effectiveness of thin ice layers as diffusion barriers can delay dissociation for hours to days, as demonstrated experimentally by Burla & Pinnelli (2023), and is expected to be strongly microstructure-dependent, since real ice crusts may evolve via annealing, cracking, defects, and non-uniform coverage. Accordingly, the ice-layer thicknesses obtained here should be interpreted as equilibrium configurations relevant for buoyancy and interfacial energetics, rather than as guarantees of long-term preservation.
An additional limitation concerns the pressure conditions expected at the ice–ocean interfaces of large icy bodies. Pressures at the ice–ocean interface of large ocean worlds are expected to reach hundreds of MPa owing to the weight of thick ice shells and the gravitational field of the body (e.g. Nimmo et al. 2025; Rudolph et al. 2026). For example, Pluto is thought to possess a thick ice shell, and hydrostatic pressures at the internal ice–ocean interface may reach values of order ~200 MPa (Nimmo et al. 2025 and references therein), which is roughly two orders of magnitude higher than the quadruple-point pressures of methane (~2.9 MPa) and CO2 (~1 MPa) clathrates. Under such conditions, hydrate dissociation would produce liquid water rather than ice, making the formation of self-preserving ice coatings at the ocean interface unlikely. In such environments, flotation of micron-scale hydrate grains stabilised by thin ice layers would therefore not be expected to occur directly at depth, but could only arise if hydrate particles were transported into shallower regions of the ice shell where pressures approach near-freezing, near-quadruple-point conditions.
A similar argument likely applies to most large ocean worlds in the Solar System (e.g. Europa, Ganymede, Callisto, Titan, and Triton), where hydrostatic pressures beneath thick ice shells are expected to exceed the clathrate quadruple-point pressures. In contrast, Enceladus represents a notable exception: owing to its small size and low gravity, pressures at the base of its ice shell are estimated to be of order ~2 MPa, comparable to the quadruple-point pressures of methane and CO2 clathrates. This makes Enceladus one of the few known ocean worlds where near-quadruple-point conditions may occur naturally at the ice–ocean interface, and where the self-preservation regime considered in this work could plausibly operate. These results should therefore not be extrapolated to large ocean worlds, where pressure conditions at the ice–ocean interface lie far outside the self-preservation regime.
5 Conclusions
In this study, we have explored the buoyancy properties of mixed CO2–CH4 GHs and the role of self-preserving ice layers formed due to Casimir–Lifshitz dispersion forces at near-quadrupolepoint conditions. Our model establishes the energetic feasibility of ice-layer formation as a prerequisite for self-preservation. We emphasise that this self-preservation corresponds to a metastable state outside the hydrate thermodynamic stability field and does not imply indefinite stability over geological timescales. In addition, our model does not predict hydrate survival times since assessing long-term persistence requires extended coupled kinetic-transport studies.
We predict that mixed CO2–CH4 GHs, especially those with a higher CH4 content and LO surface regions, exhibit enhanced buoyancy due to the formation of thicker self-preserving ice layers. These ice-coated hydrates, which can reach micron-scale thicknesses, have the potential to float within the water columns of low-gravity ocean worlds under favourable pressure conditions, contributing to regional deposits that potentially extend over significant areas. This buoyant, ice-coated structure may play a crucial role in the thermal insulation of subsurface oceans by helping maintain liquid water and potentially supporting conditions favourable to life.
The formation of self-preserving ice layers is influenced by the gas composition and the total gas occupancy in the hydrate. Within our Casimir–Lifshitz equilibrium calculations, decreasing the total occupancy (treated parametrically) favours the appearance of an energetic minimum and yields thicker equilibrium ice layers; however, we did not evaluate whether such LO states are thermodynamically stable or realised for a given pressure–temperature–composition (fugacity) state. Our results indicate that flotation without ice is restricted to CH4 fractions ≳60%. With stabilising ice layers, buoyancy extends to mixtures containing up to ~63% CO2, requiring about 10–20% ice by volume for micron-scale particles. These thresholds provide the quantitative limits for volatile transport and insulation on icy ocean worlds. This shows how both the lower density of methane-rich mixed hydrates (Courville et al. 2023) and the presence of self-preservation ice layers can bring CO2 towards the water surface.
These findings may have implications for the behaviour of volatiles in low-gravity ocean worlds, where pressures near the ice–ocean interface approach near-quadruple-point conditions. Over timescales relevant to the persistence of self-preserving ice layers, planetary-scale shells of ice-coated GHs might influence local thermal properties. Additionally, the destabilisation of these ice-coated hydrates may contribute to further mass redistribution within the ice shell, potentially producing geysers and gas plumes, such as those observed on Enceladus, and providing an ongoing source of material for the surface and outer atmosphere of such bodies.
Our model suggests that buoyant ice-stabilised CO2–CH4 hydrates could play a role in volatile transport processes on low-gravity ocean worlds such as Enceladus. In contrast, on larger ocean worlds (e.g. Pluto, Europa, Titan, or Ganymede), where hydrostatic pressures at the ice–ocean interface are expected to exceed clathrate quadruple-point pressures by orders of magnitude, the self-preservation mechanism considered here is unlikely to operate directly at depth. Quantifying hydrate survival over geological timescales would require explicit kinetic modelling of diffusion and dissociation, which is beyond the scope of the present study.
Data availability
The data underlying this article are available in a public repository at https://github.com/inaciolarissa/AeA-2026-Esteso-et-al.
Acknowledgements
LI, SKP, and MB’s research contributions are part of the project No. 2022/47/P/ST3/01236 co-funded by the National Science Centre and the European Union’s Horizon 2020 research and innovation programme under the Maria Skłodowska-Curie grant agreement No. 945339. Institutional and infrastructural support for the ENSEMBLE3 Centre of Excellence was provided through the ENSEMBLE3 project (MAB/2020/14) delivered within the Foundation for Polish Science International Research Agenda Programme and co-financed by the European Regional Development Fund and the Horizon 2020 Teaming for Excellence initiative (Grant Agreement No. 857543), as well as the Ministry of Education and Science initiative “Support for Centres of Excellence in Poland under Horizon 2020” (MEiN/2023/DIR/3797). S.C.P. acknowledges the Severo Ochoa Centres of Excellence program through Grant CEX2024-001445-S, and grant CNS2022-135967 funded by MICIU/AEI /10.13039/501100011033 and by the European Union NextGenerationEU/PRTR. V.E. acknowledges JDC2022-048530-I funded by MICIU/AEI /10.13039/501100011033 and by the European Union NextGenerationEU/PRTR, the Ministerio de Universidades of Spain, and the University of Seville under the Grant Margarita Salas and postdoctoral Grant Junta de Andalucía no. USE-26180-Y. RWC acknowledges the kind hospitality at Ensemble3-Centre of Excellence during early parts of the work with this manuscript. We thank Subhojit Pal for fruitful discussions and some input at an early stage of this manuscript.
References
- Aspnes, D. E. 1982, Am. J. Phys., 50, 704 [NASA ADS] [CrossRef] [Google Scholar]
- Bonnefoy, O., Gruy, F., & Herri, J.-M. 2005a, Mater. Chem. Phys., 89, 336 [Google Scholar]
- Bonnefoy, O., Gruy, F., & Herri, J.-M. 2005b, Fluid Phase Equilibria, 231, 176 [Google Scholar]
- Boström, M., Corkery, R. W., Lima, E. R. A., et al. 2019, ACS Earth Space Chem., 3, 1014 [Google Scholar]
- Boström, M., Esteso, V., Fiedler, J., et al. 2021, A&A, 650, A54 [NASA ADS] [CrossRef] [EDP Sciences] [Google Scholar]
- Boström, M., Kuthe, S., Carretero-Palacios, S., et al. 2023, Phys. Rev. B, 108, 125434 [Google Scholar]
- Bouquet, A., Mousis, O., Waite, J. H., & Picaud, S. 2015, Geophys. Res. Lett., 42, 1334 [Google Scholar]
- Buhmann, S. Y. 2012, Dispersion Forces I: Macroscopic Quantum Electrodynamics and Ground-state Casimir, Casimir-Polder and van der Waals Forces (Heidelberg: Springer) [Google Scholar]
- Burla, S. K., & Pinnelli, P. S. R. 2023, Case Stud. Chem. Environ. Eng., 7, 100335 [Google Scholar]
- Castillo-Rogez, J., Weiss, B., Beddingfield, C., et al. 2023, J. Geophys. Res. Planets, 128, e2022JE007432 [Google Scholar]
- Catling, D. C., & Kasting, J. F. 2017, Atmospheric Evolution on Inhabited and Lifeless Worlds (Cambridge: Cambridge University Press) [Google Scholar]
- Cladek, B. R., Everett, S. M., McDonnell, M. T., et al. 2021, Commun. Chem., 4, 6 [Google Scholar]
- Courville, S. W., Castillo-Rogez, J. C., Daswani, M. M., et al. 2023, Planet. Sci. J., 4, 179 [Google Scholar]
- Delsemme, A. H. 1973, in Cosmochemistry, ed. A. G. W. Cameron (Dordrecht: Springer Netherlands), 89 [Google Scholar]
- Delsemme, A. H., & Swings, P. 1952, Ann. Astrophys., 15, 1 [NASA ADS] [Google Scholar]
- Dickens, G. R., & Quinby-Hunt, M. S. 1994, Geophys. Res. Lett., 21, 2115 [Google Scholar]
- Elbaum, M., & Schick, M. 1991a, Phys. Rev. Lett., 66, 1713 [Google Scholar]
- Elbaum, M., & Schick, M. 1991b, J. Phys. I France, 1, 1665 [Google Scholar]
- Ellingsen, S. A. 2007, J. Phys. A: Math. Theor., 40, 1951 [Google Scholar]
- Esteso, V., Carretero-Palacios, S., & Míguez, H. 2015, J. Phys. Chem. C, 119, 5663 [Google Scholar]
- Esteso, V., Carretero-Palacios, S., & Miguez, H. 2019, J. Phys. Chem. Lett., 10, 5856 [Google Scholar]
- Esteso, V., Carretero-Palacios, S., MacDowell, L. G., et al. 2020, Phys. Chem. Chem. Phys., 22, 11362 [Google Scholar]
- Esteso, V., Frustaglia, D., Carretero-Palacios, S., & Míguez, H. 2024, Adv. Phys. Res., 3, 2300065 [Google Scholar]
- Feyzi, V., & Mohebbi, V. 2021, J. Mol. Liq., 344, 117878 [Google Scholar]
- Fiedler, J., Thiyam, P., Kurumbail, A., et al. 2017, J. Phys. Chem. A, 121, 9742 [Google Scholar]
- Fiedler, J., Boström, M., Persson, C., et al. 2020, J. Phys. Chem. B, 124, 3103 [Google Scholar]
- Fonti, S., & Marzo, G. A. 2010, A&A, 512, 1 [Google Scholar]
- Glein, C. R., & Waite, J. H. 2020, Geophys. Res. Lett., 47, e2019GL085885 [Google Scholar]
- Glein, C. R., Postberg, F., & Vance, S. D. 2018, in Enceladus and the Icy Moons of Saturn, eds. P. M. Schenk, R. N. Clark, C. J. A. Howett, A. J. Verbiscer, & J. H. Waite (Tucson: The University of Arizona Press), 39 [Google Scholar]
- Hall, D. L., Sterner, S. M., & Bodnar, J. R. 1988, Econ. Geol., 83, 197 [Google Scholar]
- Hallbrucker, A., & Mayer, E. 1990, J. Chem. Soc., Faraday Trans., 86, 3785 [Google Scholar]
- Hamilton, D. P., & Burns, J. A. 1994, Science, 264, 550 [Google Scholar]
- Hillier, J. K., Green, S. F., McBride, N., et al. 2007, MNRAS, 377, 1588 [Google Scholar]
- Kamata, S., Nimmo, F., Sekine, Y., et al. 2019, Nat. Geosci., 12, 407 [Google Scholar]
- Khawaja, N., Postberg, F., O’Sullivan, T. R., et al. 2025, Nat. Astron., 9, 1662 [Google Scholar]
- Li, Y., Brevik, I., Malyi, O. I., & Boström, M. 2023a, Phys. Rev. E, 108, 034801 [Google Scholar]
- Li, Y., Corkery, R. W., Carretero-Palacios, S., et al. 2023b, Phys. Chem. Chem. Phys., 25, 6636 [Google Scholar]
- Lide, D. R., ed. 2005, CRC Handbook of Chemistry and Physics 86th edn. (Boca Raton (FL): CRC Press) [Google Scholar]
- Luengo-Márquez, J., & MacDowell, L. G. 2021, J. Colloid Interface Sci., 590, 527 [Google Scholar]
- Luengo-Marquez, J., Izquierdo-Ruiz, F., & MacDowell, L. G. 2022, J. Chem. Phys., 157, 044704 [Google Scholar]
- Mousis, O., Chassefiere, E., Holm, N. G., et al. 2015, Astrobiology, 15, 308 [Google Scholar]
- Nimmo, F., Hamilton, D. P., McKinnon, W. B., et al. 2016, Nature, 540, 94 [Google Scholar]
- Nimmo, F., Bierson, C., & McKinnon, W. B. 2025, in Triton and Pluto, 2514 (IOP Publishing), 2 [Google Scholar]
- Nna-Mvondo, D., Tobie, G., Le Menn, E., & Grasset, O. 2021, Icarus, 358, 114182 [Google Scholar]
- Ohgaki, K., Takano, K., Sangawa, H., Matsubara, T., & Nakano, S. 1996, J. Chem. Eng. Jpn., 29, 478 [Google Scholar]
- Ouyang, Q., Pandey, J. S., & von Solms, N. 2022, Fuel, 320, 123985 [Google Scholar]
- Palodkar, A. V., & Jana, A. K. 2017, Sci. Rep., 7, 6392 [Google Scholar]
- Pang, K. D., Voge, C. C., Rhoads, J. W., & Ajello, J. M. 1984, J. Geophys. Res. Solid Earth, 89, 9459 [Google Scholar]
- Parsons, D., & Ninham, B. W. 2010, Langmuir, 26, 1816 [Google Scholar]
- Parsons, D. F., Boström, M., Nostro, P. L., & Ninham, B. W. 2011, Phys. Chem. Chem. Phys., 13, 12352 [Google Scholar]
- Parsons, D. F., Carucci, C., & Salis, A. 2022, Phys. Chem. Chem. Phys., 24, 6544 [Google Scholar]
- Pavlenko, A. 2021, Rocz. Ochr. Srod., 23, 346 [Google Scholar]
- Postberg, F., Kempf, S., Hillier, J., et al. 2008, Icarus, 193, 438 [Google Scholar]
- Postberg, F., Kempf, S., Schmidt, J., et al. 2009, Nature, 459, 1098 [Google Scholar]
- Postberg, F., Schmidt, J., J., H., Kempf, S., & Srama, R. 2011, Nature, 474, 620 [Google Scholar]
- Postberg, F., Khawaja, N., Abel, B., et al. 2018, Nature, 558, 564 [Google Scholar]
- Qasim, M., Baig, K., Kvamme, B., & Bauman, J. 2012, Int. J. Energy Environ., 6, 479 [Google Scholar]
- Rudolph, M. L., Manga, M., Rhoden, A. R., & Walker, M. 2026, Nat. Astron., 10, 76 [Google Scholar]
- Safi, E., Thompson, S. P., Evans, A., et al. 2017, A&A, 600, 1 [Google Scholar]
- Salis, A., Cappai, L., Carucci, C., Parsons, D. F., & Monduzzi, M. 2020, J. Phys. Chem. Lett., 11, 6805 [Google Scholar]
- Schenk, P. M., Clark, R. N., Howett, C. J. A., Verbiscer, A. J., & Waite, J. H., eds. 2018, Enceladus and the Icy Moons of Saturn (Tucson: The University of Arizona Press) [Google Scholar]
- Shakhova, N., Semiletov, I., & Chuvilin, E. 2019, Geosciences, 9, 251 [Google Scholar]
- Showalter, M. R. N., Cuzzi, J., & Larson, S. M. 1991, Icarus, 94, 451 [CrossRef] [Google Scholar]
- Sloan Jr., E., & Koh, C. 2007, Clathrate Hydrates of Natural Gases (Boca Raton: CRC Press) [Google Scholar]
- Stern, L. A., Circone, S., Kirby, S. H., & Durham, W. B. 2001, J. Phys. Chem. B, 105, 1756 [Google Scholar]
- Stern, L. A., Circone, S., Kirby, S. H., & Durham, W. B. 2003, Can. J. Phys., 81, 271 [Google Scholar]
- Takeya, S., & Ripmeester, J. A. 2008, Angew. Chem. Int. Ed., 47, 1276 [Google Scholar]
- Tegler, S. C., Cornelison, D. M., Grundy, W. M., et al. 2010, ApJ, 725, 1296 [Google Scholar]
- Thiyam, P., Fiedler, J., Buhmann, S. Y., et al. 2018, J. Phys. Chem. C, 122, 15311 [Google Scholar]
- Uchida, T., Ikeda, I. Y., Takeya, S., et al. 2005, ChemPhysChem, 6, 646 [Google Scholar]
- Waite, J. H., Glein, C. R., Perryman, R. S., et al. 2017, Science, 356, 155 [Google Scholar]
- Zhao, R., Li, L., Yang, S., et al. 2019, Science, 364, 984 [Google Scholar]
- Zhdanov, R. K., Gets, K. V., Belosludov, R. V., et al. 2017, Fluid Phase Equilibria, 434, 87 [Google Scholar]
Appendix A Derivation of the density of a layered gas hydrate cluster
In this appendix we present the basic estimates used to evaluate the buoyancy of GH clusters in the oceans of water worlds. The mass densities (ρ) of mixed CO2–CH4 GHs for various combinations of NCO2 and NCH4 are summarised in Table A.1. These values, together with the gas molecule occupancies in the high- and LO structures, are used to estimate the mass densities of different regions within the GH.
As discussed in Boström et al. (2021), a layer of water ice can significantly alter the overall density, and consequently the buoyancy, of GH particles. Geometry effects are small for concentric sphere ice systems when the core is sufficiently thick compared to the thickness of the coating layer. A detailed definition of the relevant parameters used throughout the text can be found in the main manuscript.
Now, we present the equations used to estimate the average mass density (ρh) of the layered GH comprising a HO core and a LO surface region. This is a mass-to-volume ratio, representing the density of the hydrate particle without considering any external ice layer.
The average mass density (ρh) of the layered GH comprising a HO core and a LO surface region. The volume of the HO core (VHO) is given by
![Mathematical equation: $\[V_{\mathrm{HO}}=\frac{4}{3} \pi r_{\mathrm{c}}^3, \quad r_{\mathrm{c}}=r_{\mathrm{h}}-d_{\mathrm{LO}},\]$](/articles/aa/full_html/2026/06/aa57290-25/aa57290-25-eq16.png) (A.1)
(A.1)
where rc is the radius of the HO core, rh is the radius of the hydrate particle, and dLO is the average thickness of the LO surface region. The volume of the LO region (VLO) is
![Mathematical equation: $\[V_{\mathrm{LO}}=\frac{4}{3} \pi r_{\mathrm{h}}^3-V_{\mathrm{HO}},\]$](/articles/aa/full_html/2026/06/aa57290-25/aa57290-25-eq17.png) (A.2)
(A.2)
The masses of the HO core and the LO region are
![Mathematical equation: $\[m_{\mathrm{HO}}=\rho_{\mathrm{HO}} \times V_{\mathrm{HO}}, \quad \text { and } \quad m_{\mathrm{LO}}=\rho_{\mathrm{LO}} \times V_{\mathrm{LO}},\]$](/articles/aa/full_html/2026/06/aa57290-25/aa57290-25-eq18.png) (A.3)
(A.3)
respectively. The average mass density (ρh) of the layered GH is
![Mathematical equation: $\[\rho_{\mathrm{h}}=\frac{m_{\mathrm{HO}}+m_{\mathrm{LO}}}{V_{\mathrm{HO}}+V_{\mathrm{LO}}}=\frac{\rho_{\mathrm{HO}} \times V_{\mathrm{HO}}+\rho_{\mathrm{LO}} \times V_{\mathrm{LO}}}{V_{\mathrm{HO}}+V_{\mathrm{LO}}}.\]$](/articles/aa/full_html/2026/06/aa57290-25/aa57290-25-eq19.png) (A.4)
(A.4)
Using Eqs. (A.1) and (A.2) in Eq. (A.4), we find
![Mathematical equation: $\[\rho_{\mathrm{h}}=\frac{\rho_{\mathrm{HO}} r_{\mathrm{c}}^3+\rho_{\mathrm{LO}}\left(r_{\mathrm{h}}^3-r_{\mathrm{c}}^3\right)}{r_{\mathrm{h}}^3}.\]$](/articles/aa/full_html/2026/06/aa57290-25/aa57290-25-eq20.png) (A.5)
(A.5)
Next, the average density (ρav) of an ice-coated GH particle that includes the mass contributions from both the hydrate particle (with the HO and LO regions) and the external ice shell that forms on it. It is derived using the same method, with the following expression:
![Mathematical equation: $\[\rho_{\mathrm{av}}=\frac{\rho_{\mathrm{h}} r_{\mathrm{h}}^3+\rho_{\mathrm{ice}}\left[\left(r_{\mathrm{h}}+d\right)^3-r_{\mathrm{h}}^3\right]}{\left(r_{\mathrm{h}}+d\right)^3},\]$](/articles/aa/full_html/2026/06/aa57290-25/aa57290-25-eq21.png) (A.6)
(A.6)
where ρice is the mass density of water in pure ice and rice = rh + d. Here d is the thickness of the ice layer.
These equations form the basis for calculating the buoyancy of GH clusters as a function of their composition and gas-molecule occupancy. They therefore allow us to analyse how these factors influence the floating or sinking behaviour of hydrate clusters in different ocean environments.
Mass density of mixed CO2–CH4 GHs for different cage occupancies.
All Tables
All Figures
|
Fig. 1 Schematic diagram of the four-layer mixed CO2–CH4 hydrate system: HO mixed GH (characterised by ε1), LO mixed GH (ε2), pure H2O ice (ε3), and pure liquid H2O (ε4). The thicknesses of the LO mixed-hydrate region and the ice layer are denoted by dLO and d, respectively. Black and orange dots in the HO layer indicate CO2 and CH4 molecules, respectively, distributed within the hydrate lattice. We have chosen to show HO with Ng = NCO2 + NCH4 = 8 and LO with Ng = 0 in this figure. |
| In the text | |
|
Fig. 2 Dielectric functions at T = 273.16 K, evaluated at imaginary frequencies, for different materials: water and ice from Luengo-Marquez et al. (2022) – Table IV for water and Table VI for Ice. We show LO GHs (Ng = 0), and HO mixed CO2–CH4 GHs (Ng = 8). Various mixed compositions of CO2 and CH4 are considered (NCO2, NCH4). Here, Ng = NCO2 + NCH4 represents the number of gas molecules per 46 water molecules in the GH structures, with values between zero and eight. The static values used to ε(0) are 91.5 for ice (Elbaum & Schick 1991b), 87.8 for water (model from Fiedler et al. 2020), and 17.7 for the empty GH structure (Ng = 0). For the HO mixed GHs, we take 24.4 and 25.5 for the fully occupied structure (Ng = 8) with CO2 or CH4, respectively. |
| In the text | |
|
Fig. 3 Mass density of bulk homogeneous mixed CO2–CH4 hydrates as a function of the number of CO2 molecules per unit cell (NCO2). Different colours indicate varying numbers of CH4 molecules (NCH4). The dotted horizontal lines represent the estimated range of ocean water density on Enceladus (~1.003–1.03 g/cm3; Safi et al. 2017; Bouquet et al. 2015). The data are derived in the appendix and taken from Table A.1. |
| In the text | |
|
Fig. 4 Casimir–Lifshitz free energy in a three-layered system consisting of mixed CO2–CH4 GHs-ice-water as a function of ice layer thickness. Systems correspond to combinations of NCO2 + NCH4 = 2 and NCO2 + NCH4 = 3. The minimum of each curve indicates the predicted self-preserving ice thickness at equilibrium, d. |
| In the text | |
|
Fig. 5 Casimir–Lifshitz free energy in a four-layered system consisting of mixed CO2–CH4 GHs (HO–LO–ice–water) as a function of ice layer thickness. In the HO surface region, the composition varies with NCO2 = 5 and NCH4 = 0–3. The LO layer is empty, and its thickness is fixed at dLO = 50 nm. |
| In the text | |
|
Fig. 6 Casimir–Lifshitz free energy in a four-layered system consisting of mixed CO2–CH4 GHs (HO–LO–ice–water) as a function of ice layer thickness. The total HO hydrate layer is fixed at Ng = 8, while the LO surface region is taken as empty (Ng = 0). Consequently, the HO core contains the full occupancy, with its CO2–CH4 composition varied. The LO layer thickness is fixed at dLO = 50 nm. |
| In the text | |
|
Fig. 7 Casimir–Lifshitz free energy in a four-layered system consisting of mixed CO2–CH4 GHs (HO–LO–ice–water) as a function of ice layer thickness. The systems correspond to a total HO region occupancy of NCO2 = 8. The LO layer thickness is fixed at dLO = 50 nm, with Ng varying from zero to three. |
| In the text | |
|
Fig. 8 Casimir–Lifshitz free energy in a four-layered system consisting of mixed CO2–CH4 GHs (HO–LO–ice–water) as a function of ice layer thickness. The systems correspond to a total occupancy in the HO region of NCO2 = 8 and a surface region with Ng = 0. The LO region thickness, dLO, is varied from 5 to 50 nm. |
| In the text | |
|
Fig. 9 Effective density of CO2 hydrate particles as a function of radius rh for different thicknesses of the outer LO layer (dLO). Details are given in Table 2. For comparison, a dashed and a dashed-dotted horizontal line representing densities for the ocean water on Enceladus, such as 1.003 g/cm3 and 1.03 g/cm3 reported in Safi et al. (2017) and Bouquet et al. (2015), respectively, are included. |
| In the text | |
|
Fig. 10 Effective density of CO2 hydrate particles as a function of radius rh for a fixed value of thicknesses of the outer LO layer, dLO = 10 nm. Details are given in Table 2. For comparison, a dashed and dashed-dotted line have been included. These lines represent densities for the ocean water on Enceladus, such as 1.003 g/cm3 and 1.03 g/cm3 reported in Safi et al. (2017), and Bouquet et al. (2015), respectively. |
| In the text | |
|
Fig. 11 Effective density of CO2 hydrate particles as a function of radius rh for a fixed value of thicknesses of the outer LO layer, dLO = 40 nm. Details are given in Table 2. For comparison, a dashed and dashed-dotted line have been included. These lines represent densities for the ocean water on Enceladus, such as 1.003 g/cm3 and 1.03 g/cm3 reported in Safi et al. (2017), and Bouquet et al. (2015), respectively. |
| In the text | |
Current usage metrics show cumulative count of Article Views (full-text article views including HTML views, PDF and ePub downloads, according to the available data) and Abstracts Views on Vision4Press platform.
Data correspond to usage on the plateform after 2015. The current usage metrics is available 48-96 hours after online publication and is updated daily on week days.
Initial download of the metrics may take a while.