


Fig. 11
Download original image
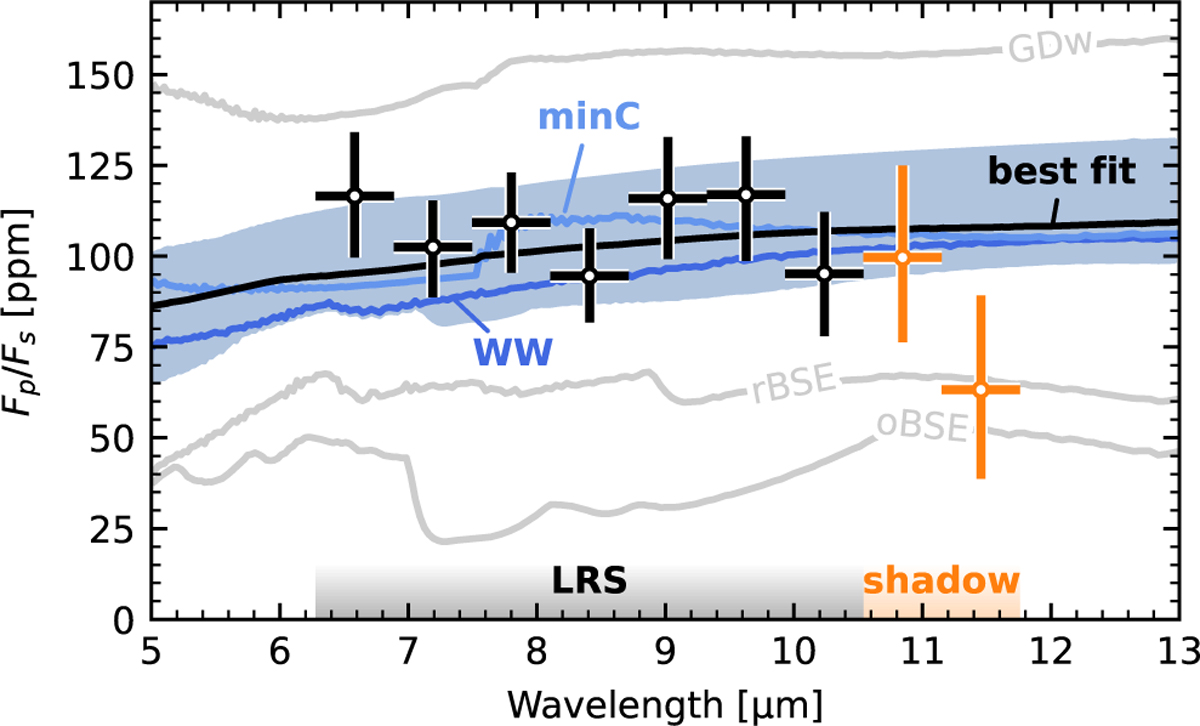
Observations from MIRI of 55 Cancri e (black markers, Hu et al. 2024), including the MIRI shadow region (orange markers), compared to a selection of synthetic emission spectra (coloured and grey lines). The blue shaded area indicates the range of spectra that matches the observation, based on a χ2-fit (excluding the shadow region). Three endmembers within the set of matching models are highlighted: the best fit (black, ΨVMF = 0, ΔIW-6 and ξ = 0.5), a mineral-rich He–H2–CO–SiO–atmosphere (minC, bright blue, ΨVMF = −1, ΔIW-6 and ξ = 0.1), and a waterworld (WW, dark blue, ΨVMF = 1, ΔIW+6 and ξ = 0). Relevant non-fitting models are shown in grey and comprise the gas-dwarf scenario (GDw, ΨVMF = 1, ΔIW-6 and ξ =0) as well as a reduced (rBSE, ΨVMF = 0, ΔIW-3 and ξ =1) and an oxidised VIBSE scenario (oBSE, ΨVMF = 0, ΔIW+3 and ξ = 1).
Current usage metrics show cumulative count of Article Views (full-text article views including HTML views, PDF and ePub downloads, according to the available data) and Abstracts Views on Vision4Press platform.
Data correspond to usage on the plateform after 2015. The current usage metrics is available 48-96 hours after online publication and is updated daily on week days.
Initial download of the metrics may take a while.