


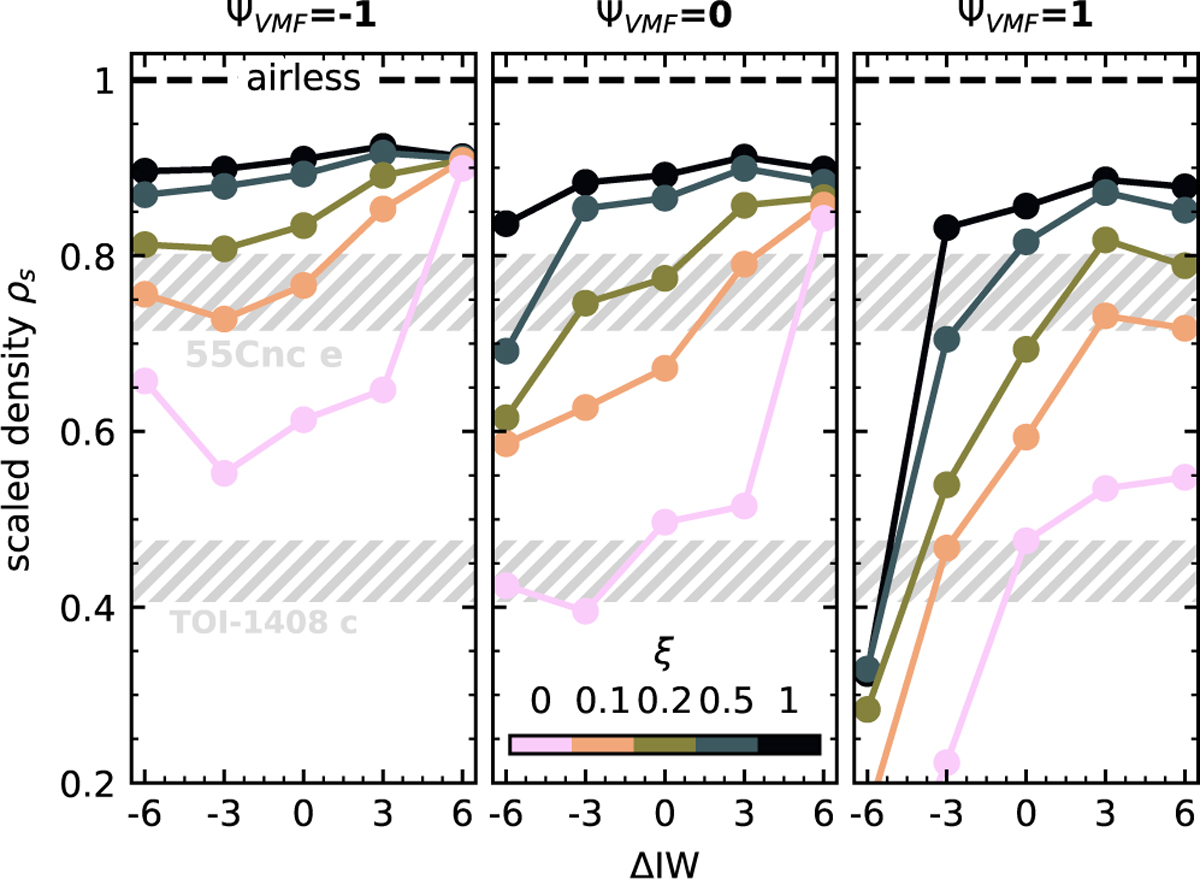
Fig. 10
Download original image
Average scaled density of the synthetic models from Fig. 8 in the Kepler/TESS bandpass (400–900 nm), shown as a function of ΔIW and ΨVMF (coloured lines and dots). The colour corresponds to ξ. The simulations are compared to the inferred scaled densities for 55 Cancri e and TOI-1408 c, which are shown as grey bands; their width denotes the 1σ limit. The dashed black line indicates the scaled density of an atmosphere-free (airless) planet, i.e. Rp,MAI (Sect. 2.1.1).
Current usage metrics show cumulative count of Article Views (full-text article views including HTML views, PDF and ePub downloads, according to the available data) and Abstracts Views on Vision4Press platform.
Data correspond to usage on the plateform after 2015. The current usage metrics is available 48-96 hours after online publication and is updated daily on week days.
Initial download of the metrics may take a while.