| Issue |
A&A
Volume 709, May 2026
|
|
|---|---|---|
| Article Number | L20 | |
| Number of page(s) | 7 | |
| Section | Letters to the Editor | |
| DOI | https://doi.org/10.1051/0004-6361/202660007 | |
| Published online | 22 May 2026 | |
Letter to the Editor
Nature and nurture: The dynamical ages of in situ and accreted globular clusters in the Milky Way
INAF-Osservatorio di Astrofisica e Scienza dello Spazio di Bologna, Via P. Gobetti 93/3, I-40129 Bologna, Italy
⋆ Corresponding author: This email address is being protected from spambots. You need JavaScript enabled to view it.
Received:
23
March
2026
Accepted:
23
April
2026
Abstract
The bifurcated age-metallicity relation of globular clusters (GCs) in the Milky Way (MW) shows that GCs either originated in situ or accreted into the Galaxy from former satellites of the MW. The effects of the Galactic tidal field can leave signatures on the dynamical evolution and structural properties of GCs. We present a homogeneous census of dynamical ages for a sample of 93 GCs in the MW coupled with the knowledge of their common progenitors from the chemo-dynamical parameters from the Gaia mission, which was unavailable some years ago. We find that the majority of accreted GCs (61%) are dynamically young, but this percentage drops to 38% for in situ GCs. When excluding the enigmatic low-energy (LE) GCs with ambiguous origin, the fraction of dynamically young ex situ GCs rises to 70%. A two tail Kolmogorov-Smirnov test showed that the distribution of dynamical ages of LE GCs cannot be distinguished from the distribution of in situ bulge and disc GCs. Yet the LE GCs are firmly located on the satellite branch of the age-metallicity relation. An explanation for this may be that the progenitor of LE GCs plunged very early into the MW so that the gravitational field of the MW had enough time to act on the associated GCs. The dynamical ages offer statistically robust evidence corroborating the scenario of early accretion proposed by several recent studies regarding the origin of LE GCs.
Key words: Galaxy: evolution / Galaxy: formation / Galaxy: general / globular clusters: general
© The Authors 2026
 Open Access article, published by EDP Sciences, under the terms of the Creative Commons Attribution License (https://creativecommons.org/licenses/by/4.0), which permits unrestricted use, distribution, and reproduction in any medium, provided the original work is properly cited.
This article is published in open access under the Subscribe to Open model. This email address is being protected from spambots. You need JavaScript enabled to view it. to support open access publication.
1. Introduction
The age-metallicity relation (AMR) of globular clusters (GCs) in the Milky Way (MW) is divided into two parallel branches (e.g. Leaman et al. 2013; VandenBerg et al. 2013). The metal-rich branch hosts GCs with disk-like kinematics and consists of clusters formed in situ in the Galaxy. The metal-poor GCs with halo-type orbits were suggested to be formed in low-mass satellite systems that were later on accreted, contributing to the hierarchical formation history of the MW. This double formation channel is strongly substantiated by a wealth of chemo-dynamical studies exploiting the data from the astrometric Gaia mission (e.g. Massari et al. 2019; Kruijssen et al. 2019; Forbes 2020; Callingham et al. 2022; Malhan et al. 2022).
The characteristic radii of GCs are used to investigate their internal dynamics and the effects of the global MW gravitational field on the long-term dynamical evolution of these stellar systems (e.g. Meylan & Heggie 1997; Piatti et al. 2019). In this work we present, for a large sample of MW GCs, a scrutiny of dynamical ages defined as the ratio between the chronological ages and the half-mass relaxation times. Since the latter differ from cluster to cluster depending on the local conditions (e.g. the distance from the central potential well, the average density of the regions inhabited by the cluster), different stages of dynamical evolution can be shared by GCs with the same chronological ages.
We add here the knowledge on the progenitors of different groups of GCs gained thanks to the Gaia mission, which was unavailable some years ago, although some attributions are still uncertain. Most notable is the case of the low-energy (LE) GCs (Massari et al. 2019, hereinafter M19), whose origin is still attributed to an in situ component or to a former accretion event variously dubbed Kraken (Kruijssen et al. 2020; K20), Koala (Forbes 2020), or Heracles (Horta et al. 2021; see also Massari et al. 2026). The combination of these different pieces of information seems to show that the overwhelming majority of accreted GCs is dynamically young, as opposed to in situ GCs, which show a range in dynamical ages. Moreover, the pattern of dynamical ages for LE GCs is similar to those of in situ disc and bulge GCs, although LE GCs are firmly located on the satellite branch of the AMR.
2. Dataset and main results
Following Dalessandro et al. (2024), we computed the ratio Nh = tage/trh as a proxy of GC dynamical age. The chronological ages, tage, are from Kruijssen et al. (2019). While these chronological ages are from the combination of three other studies, this dataset is currently the most homogeneous set of ages available for the largest number of GCs. We adopted the half-mass relaxation time trh from the publicly available catalogue by Baumgardt et al. (2019), and as in Dalessandro et al. (2024), we defined dynamically young GCs as those with Nh < 8. This is the threshold at which the chemically polluted population in GCs, which is the largest stellar component in GCs (e.g. Carretta et al. 2010), shows a clear change in the average velocity distribution, moving from a radially anisotropic velocity distribution to an isotropic pattern in dynamically old GCs. The dynamical ages of the GCs are listed in Table A.1.
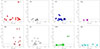 |
Fig. 2. Cumulative distributions of dynamical ages for groups of GCs with different progenitors. In each panel the p-values of the two-sample KS test are listed. |
The proposed GC membership to different progenitors was adopted mainly from the classification of M19. For GCs with uncertain progenitors, we adopted the assignments from other studies, as annotated in Table A.1, where these GCs are marked with flag=0 and with a white cross on their symbol in the figures. These ambiguous attributions do not change the main comparison between in situ and accreted GCs; they simply shift the GCs from one progenitor to another. In our sample we collected 26 in situ GCs (15 main disc, MD; 11 main bulge, MB) and 67 accreted GCs, 22 from Gaia-Enceladus (GE), 10 from the Helmi streams (H99), 5 from Sequoia (SEQ), 7 from Sagittarius (SGR), 9 from the high-energy (HE) group, and 14 from the LE group. The only relevant difference with M19 that may concern the present analysis is NGC 6441. This is a LE GC in M19 that we assigned to the MB group. This choice is clearly supported by its chemistry (e.g. Gratton et al. 2006; Carretta & Bragaglia 2023) and its location on the in situ branch of the AMR (see Fig. B.1, the discussion in K20, and Massari et al. 2023).
Our main result is shown in Fig. 1, where we plot the dynamical ages of GCs with different progenitors as a function of the metallicity [Fe/H]. The majority of accreted GCs are dynamically young. All GCs associated with Sagittarius and Sequoia are below Nh = 8, similar to all GCs attributed to the Helmi streams, except for E31 and most of the unassigned group of HE GCs with high orbital energy. A real spread in dynamical ages is shown only among the in situ GCs, with MB GCs presenting the most dynamically evolved GCs. The only GCs on the satellite branch of the AMR showing a spread of dynamical ages are the components of the LE group and, to a lesser extent, the GCs associated with GE. We found that 61 ± 10% of the 67 accreted GCs are dynamically young, where the error is from Poisson statistics. Among the 26 remaining accreted and dynamically old GCs, half are members of GE. When excluding LE GCs, the fraction of dynamically young GCs raises to 70 ± 11%. In contrast, the majority of in situ GCs (62 ± 15%) is composed of dynamically old clusters.
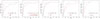 |
Fig. 1. Dynamical ages of GCs with different progenitors (different colours or symbols and labels in each panel) as a function of the metallicity [Fe/H]. White crosses indicate GCs with uncertain classification (see text). The line for Nh = 8 is also shown. Two deviant GCs are also indicated in the MD and H99 groups. |
3. Discussion and conclusions
We quantified the similarities and differences among the GCs with different progenitors with a two-sample Kolmogorov-Smirnov (KS) test under the null hypothesis that the samples are drawn from the same distribution. We compared the cumulative distributions of dynamical ages, and the resulting p-values are listed in Table 1. A few key comparisons are illustrated in Fig. 2. For the groups of GCs in the adopted classification, we show in Fig. B.1 and Fig. B.2 the AMR and the distribution of dynamical ages as a function of the Galactocentric distance, age, and total absolute cluster magnitude (a proxy for the present day mass).
Two sample KS results.
Beginning with in situ GCs and comparing the p-value to the usual α = 0.05 threshold, we found MB and MD GCs to not be significantly different (see Fig. 2). However, their similarity seems to be entirely driven by Pal 1, whose dynamical age is very old. Excluding Pal 1, the KS test shows that the distributions of MB and MD GCs are statistically different (second row in Table 1), with a range of dynamical ages in MB GCs twice the range spanned by MD GCs. We note that K20 claim that Pal 1 cannot be considered as a genuine disc GC because of its position on the extension of the satellite branch (see also Fig. B.1), and they omitted the cluster from their analysis.
Unsurprisingly, the distributions of accreted GCs are different from those of in situ GCs, apart from GCs associated with GE. For these GCs, the difference is not statistically significant. Almost all of the GCs associated with the Seq, Sgr, H99, and HE groups show dynamically young ages, whereas a range is clearly apparent among GE GCs.
The most interesting result from Table 1 and Fig. 2 concerns the group of LE GCs. The distribution of dynamical ages for these GCs cannot be distinguished from that of in situ GCs (both disc and bulge sets), whereas the KS test indicates that it is extracted from different parent populations with respect to accreted GCs.
To better understand the dynamical ages, we investigated how the nature (origin) and the nurture (influence of the tidal field on the dynamical evolution) affect the ratio of Nh. The original nature of GCs is generally indicated well by their location on the bifurcated AMR. Accreted GCs on the satellite branch generally have a lower metallicity for a fixed age, and this branch spans a larger range in ages, with a tail extending to young ages. In situ GCs are mostly located in the branch at a higher metallicity, indicating their formation in a more massive progenitor, although a tail to a lower metallicity is present among MD GCs (see Fig. B.1).
The effects of the MW tidal field on the dynamical evolution and structural parameters of GCs are best seen by revisiting the strong correlation between the mass function slope and the half-mass relaxation times found by Sollima & Baumgardt (2017). Shown for our sample in the left panel in Fig. 3, using data from Baumgardt et al. (2019), this relation is explained by GCs in a stronger tidal field experiencing more mass loss, making them more compact, reducing their relaxation times and resulting in more positive mass function slopes (fewer low-mass stars) as stars in the outskirts are progressively lost due to the increasing tidal field. In the middle and right panels of Fig. 3 we added the information about the progenitors of GCs, which unveiled a sort of segregation onto the two tails of the relation. The effects of the tidal field are particularly evident among in situ GCs (MD and MB) and LE GCs (middle panel), whereas the right panel indicates that in accreted GCs the nature of clusters formed in a weaker gravitational field prevails. The young dynamical ages were also apparently maintained for the majority of these GCs when they became part of the main Galaxy after the original fragments dissolved. A range of the mass function slopes suggests that the only group presenting a significant range of dynamical ages is that of GCs associated with GE (right panel of Fig. 3), whereas the restricted range of slopes confirm that, in general, accreted GCs are not dynamically highly evolved.
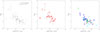 |
Fig. 3. Left: Slope of the global mass function as a function of the relaxation times for GCs from the catalogue of Baumgardt et al. (2019). Middle: Only MB, MD, and LE GCs. Right: Only Seq, H99, GE, Sgr, and HE GCs. Symbols are the same as in Fig. 1. |
The range of dynamical ages for LE GCs is comparable to that of MB GCs and larger than that covered by MD GCs. However, the LE GCs are firmly located on the satellite branch of the AMR (see Fig. B.1). A possible solution to this conundrum is that the merger event that accreted the LE GCs in the MW occurred early in the assembly process that formed our Galaxy as it is now, as suggested by several studies (K20; Horta et al. 2021; Massari et al. 2026). From TNG50 simulations, Chen & Gnedin (2024) have shown that GCs from such a merger have properties virtually indistinguishable from genuine in situ GCs since the contributing and the receiving galactic systems both had comparable masses (and therefore also metallicity) at that epoch. The resulting merger then allowed the merging GCs to penetrate the inner region in low-energy orbits. In such a manner, the permanence of these GCs in the main Galaxy was long enough that the effects of the stronger gravitational field were efficient in shaping the dynamical evolution of these clusters.
On the other hand, the nature of most accreted GCs is inherent to their formation in smaller stellar system satellites of the main Galaxy, where the weaker potential well had no way to accelerate the dynamical evolution. Apparently, after the accretion, these ex situ GCs were deposited further from the inner regions, typically experienced a weaker tidal field than the in situ GCs (see e.g. Meng & Gnedin 2022), and mostly maintained their distinctively young dynamical ages.
If the interplay of nature and nurture shapes the dynamical ages of GCs in the MW, we should find some correspondence with the global properties of the progenitor systems. Some evidence is shown in Fig. 4, where in the left panel we plot the fraction of dynamically young GCs of each progenitor system as a function of the time of accretion estimated in K20. While the relation may be not very tight and the uncertainties depend on the proposed membership of GCs, this figure shows that the fraction of dynamically young GCs is lower for those systems associated with merger events that occurred early in the assembly history of the MW. This fraction increases as the estimated stellar mass of the progenitors decreases, as expected if the tidal field of the original galaxy had a smaller impact on the dynamical evolution of the clusters. This is shown in the right panel of Fig. 4 with mass values from K20 and from the unbiased estimates from Callingham et al. (2022). In the latter case, the linear regression is statistically significant (p-value = 0.016) even with only five data points.
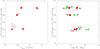 |
Fig. 4. Left: Fraction of dynamically young GCs associated with different progenitors as a function of the time of accretion in the MW estimated by K20. Right: Same fraction, versus the stellar mass of the progenitors from K20 (red circles) and from the unbiased estimates of Callingham et al. (2022: green squares). |
4. Summary
We have presented a homogeneous census of dynamical ages for a set of 93 GCs in the MW. We found that the majority of GCs located on the satellite branch of the AMR are dynamically young, whereas most in situ GCs seem to be more dynamically evolved. In summary, coupling the dynamical ages of GCs with knowledge of their original progenitors can lead to a better understanding of their properties. The nature of accreted GCs, formed in a weaker gravitational field, is revealed by their dynamically young ages. The scarce evidence of dynamical evolution seems to be maintained also after the merger of their progenitors with the main Galactic body. The only exception is the group of LE GCs, which possibly originated in a fragment that was accreted into the MW at very early epochs. The GCs associated with GE appear to be a transition group, with a mixture of dynamically old and young ages. While several conclusions of our examination are not unexpected, homogeneous sets of dynamical ages may serve as another observable property that can be used in the clustering of GCs to reconstruct their origin and the assembly history of the MW.
Kruijssen et al. (2020) classified this GC as ambiguous and possibly a member of the main Galaxy, and they excluded it from their analysis.
Acknowledgments
This research has made large use of the SIMBAD database (in particular Vizier), operated at CDS, Strasbourg, France, and of the NASA’s Astrophysical Data System. I warmly thank Angela Bragaglia for several valuable suggestions.
References
- Baumgardt, H., Hilker, M., Sollima, A., & Bellini, A. 2019, MNRAS, 482, 5138 [Google Scholar]
- Callingham, T. M., Cautun, M., Deason, A. J., et al. 2022, MNRAS, 513, 4107 [NASA ADS] [CrossRef] [Google Scholar]
- Carretta, E., & Bragaglia, A. 2023, A&A, 677, A73 [NASA ADS] [CrossRef] [EDP Sciences] [Google Scholar]
- Carretta, E., Bragaglia, A., Gratton, R. G., et al. 2010, A&A, 516, A55 [NASA ADS] [CrossRef] [EDP Sciences] [Google Scholar]
- Chen, Y., & Gnedin, O. Y. 2024, OJAp, 7, E23 [Google Scholar]
- Dalessandro, E., Cadelano, M., Della Croce, A., et al. 2024, A&A, 691, A94 [NASA ADS] [CrossRef] [EDP Sciences] [Google Scholar]
- Forbes, D. A. 2020, MNRAS, 493, 847 [Google Scholar]
- Gratton, R. G., Lucatello, S., Bragaglia, A., et al. 2006, A&A, 455, 271 [NASA ADS] [CrossRef] [EDP Sciences] [Google Scholar]
- Horta, D., Schiavon, R. P., Mackereth, J. T., et al. 2021, MNRAS, 500, 1385 [Google Scholar]
- Kruijssen, J. M. D., Pfeffer, J. L., Reina-Campos, M., Crain, R. A., & Bastian, N. 2019, MNRAS, 486, 3180 [Google Scholar]
- Kruijssen, J. M. D., Pfeffer, J. L., Chevance, M., et al. 2020, MNRAS, 498, 2472 [NASA ADS] [CrossRef] [Google Scholar]
- Leaman, R., VandenBerg, D. A., & Mendel, J. T. 2013, MNRAS, 436, 122 [Google Scholar]
- Malhan, K., Ibata, R. A., Sharma, S., et al. 2022, ApJ, 926, 107 [NASA ADS] [CrossRef] [Google Scholar]
- Massari, D. 2025, RNAAS, 9, 64 [Google Scholar]
- Massari, D., Koppelman, H. H., & Helmi, A. 2019, A&A, 630, L4 [NASA ADS] [CrossRef] [EDP Sciences] [Google Scholar]
- Massari, D., Aguado-Agelet, F., Monelli, M., et al. 2023, A&A, 680, A20 [NASA ADS] [CrossRef] [EDP Sciences] [Google Scholar]
- Massari, D., Zerbinati, C., Fanelli, C., et al. 2026, arXiv e-prints [arXiv:2601.18896] [Google Scholar]
- Meng, X., & Gnedin, O. Y. 2022, MNRAS, 515, 1065 [NASA ADS] [CrossRef] [Google Scholar]
- Meylan, G., & Heggie, D. C. 1997, A&ARv, 8, 1 [NASA ADS] [CrossRef] [Google Scholar]
- Piatti, A. E., Webb, J. J., & Carlberg, R. G. 2019, MNRAS, 489, 4367 [Google Scholar]
- Sollima, A., & Baumgardt, H. 2017, MNRAS, 471, 3668 [NASA ADS] [CrossRef] [Google Scholar]
- VandenBerg, D. A., Brogaard, K., Leaman, R., & Casagrande, L. 2013, ApJ, 775, 134 [Google Scholar]
- Youakim, K., & Lind, K. 2025, A&A, 704, A296 [Google Scholar]
Appendix A: Dynamical ages and progenitors of GCs
Classification by progenitor.
Appendix B: Dynamical ages as a function of various parameters
We show the AMR of GCs with different progenitors and their dynamical ages as a function of global parameters like Galactocentric distance, total absolute magnitude and age.
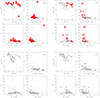 |
Fig. B.1. Age-metallicity relation (upper left) and dynamical ages as a function of the Galactocentric distance (upper right), total absolute magnitude (lower left), and age (lower right) for GCs of the MD, MB, HE, and LE groups. Empty small circles indicate the whole sample of GCs; larger symbols, the same as in Fig. 1, show GCs with different origins. The horizontal line is traced at Nh = 8. |
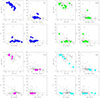 |
Fig. B.2. Same as Fig. B.1 but for GCs of the GE, H99, SEQ, and SGR groups. Symbols are the same as in Fig. 1. |
All Tables
All Figures
|
Fig. 2. Cumulative distributions of dynamical ages for groups of GCs with different progenitors. In each panel the p-values of the two-sample KS test are listed. |
| In the text | |
|
Fig. 1. Dynamical ages of GCs with different progenitors (different colours or symbols and labels in each panel) as a function of the metallicity [Fe/H]. White crosses indicate GCs with uncertain classification (see text). The line for Nh = 8 is also shown. Two deviant GCs are also indicated in the MD and H99 groups. |
| In the text | |
|
Fig. 3. Left: Slope of the global mass function as a function of the relaxation times for GCs from the catalogue of Baumgardt et al. (2019). Middle: Only MB, MD, and LE GCs. Right: Only Seq, H99, GE, Sgr, and HE GCs. Symbols are the same as in Fig. 1. |
| In the text | |
|
Fig. 4. Left: Fraction of dynamically young GCs associated with different progenitors as a function of the time of accretion in the MW estimated by K20. Right: Same fraction, versus the stellar mass of the progenitors from K20 (red circles) and from the unbiased estimates of Callingham et al. (2022: green squares). |
| In the text | |
|
Fig. B.1. Age-metallicity relation (upper left) and dynamical ages as a function of the Galactocentric distance (upper right), total absolute magnitude (lower left), and age (lower right) for GCs of the MD, MB, HE, and LE groups. Empty small circles indicate the whole sample of GCs; larger symbols, the same as in Fig. 1, show GCs with different origins. The horizontal line is traced at Nh = 8. |
| In the text | |
|
Fig. B.2. Same as Fig. B.1 but for GCs of the GE, H99, SEQ, and SGR groups. Symbols are the same as in Fig. 1. |
| In the text | |
Current usage metrics show cumulative count of Article Views (full-text article views including HTML views, PDF and ePub downloads, according to the available data) and Abstracts Views on Vision4Press platform.
Data correspond to usage on the plateform after 2015. The current usage metrics is available 48-96 hours after online publication and is updated daily on week days.
Initial download of the metrics may take a while.