


Fig. 7.
Download original image
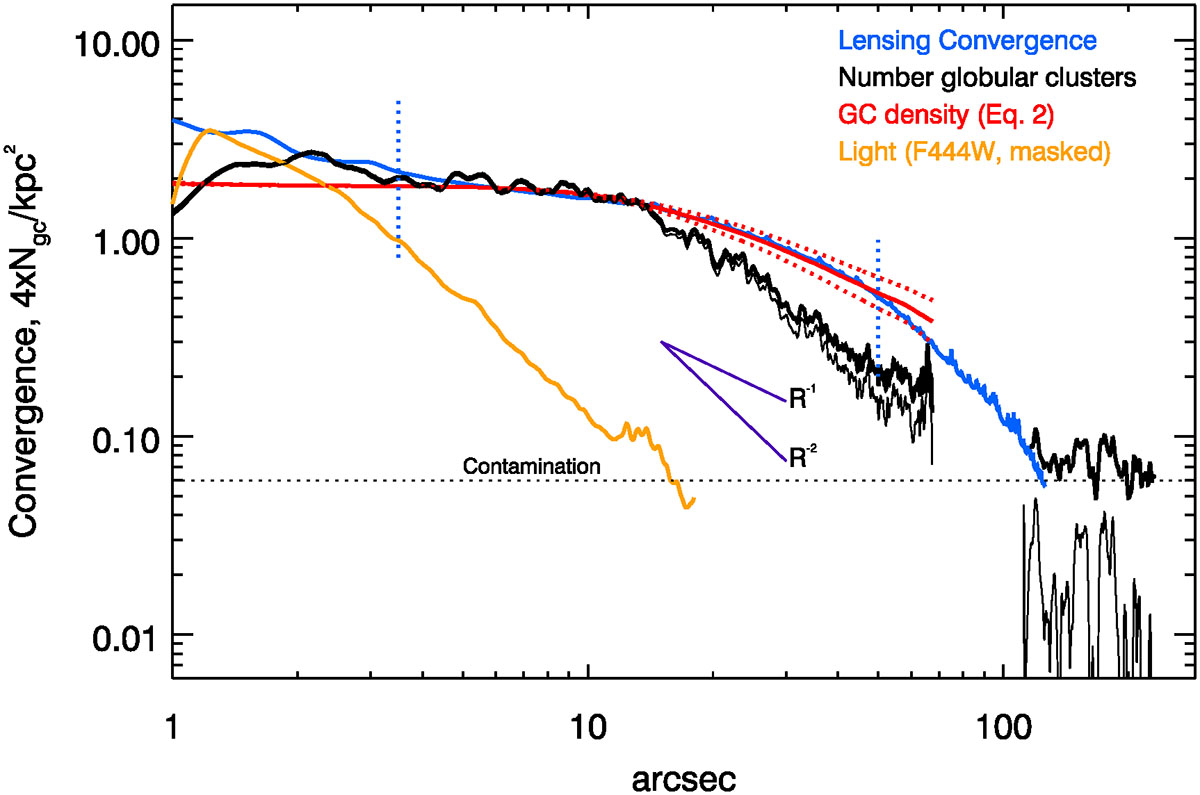
Profiles of AS1063 centered on the BCG. The projected mass from the lens model is plotted as dark blue (in units of Σ/Σcrit), with the two vertical dotted blue lines marking the range of distances with lensing constraints. The light profile (including the intracluster light) in the filter F444W is shown as an orange line. The map of the light is masked and only the unamasked pixels are used for the profile. The masked BCG results in a nil light profile at the very center. The number density of GCs is shown as a thick black line that is re-scaled by a factor of four to match the convergence profile for easier comparison. The gap in the profile corresponds to the gap between the two modules where no GCs are detected. The GC number density profile at large radii (100″ ≲ r ≲ 250″) was computed in the second module. After subtracting the estimated level of contamination from background objects (horizontal dotted line), the resulting corrected profile is shown in black as a thin solid line. The solid red line shows the profile of ρgc for α = 1.6. The top dotted red line shows the case for α = 1.4 and the bottom dotted red line is the case for α = 1.8.
Current usage metrics show cumulative count of Article Views (full-text article views including HTML views, PDF and ePub downloads, according to the available data) and Abstracts Views on Vision4Press platform.
Data correspond to usage on the plateform after 2015. The current usage metrics is available 48-96 hours after online publication and is updated daily on week days.
Initial download of the metrics may take a while.