


Fig. 2.
Download original image
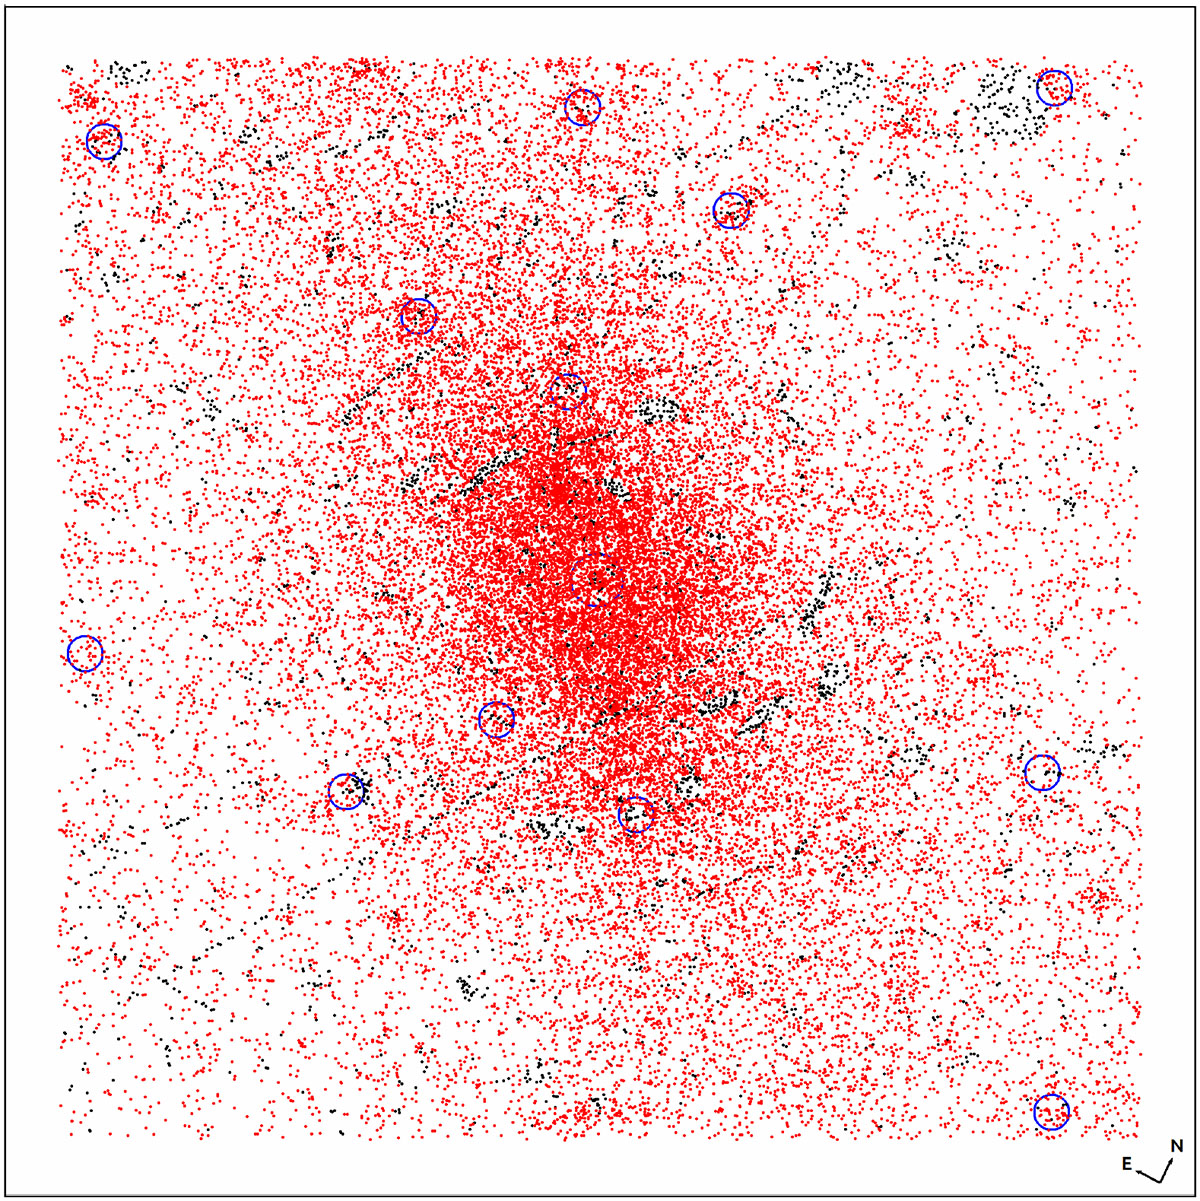
Map of GC distribution obtained from the data (red points, 28026) and inpainted (black points, 3501) in the masked regions. Some artifacts (diffraction spikes) and large lensed galaxies (giant arcs) are obvious in the distribution of inpainted points. Big blue circles mark the position of prominent members (white circles in Fig. 1).
Current usage metrics show cumulative count of Article Views (full-text article views including HTML views, PDF and ePub downloads, according to the available data) and Abstracts Views on Vision4Press platform.
Data correspond to usage on the plateform after 2015. The current usage metrics is available 48-96 hours after online publication and is updated daily on week days.
Initial download of the metrics may take a while.