


Fig. 1.
Download original image
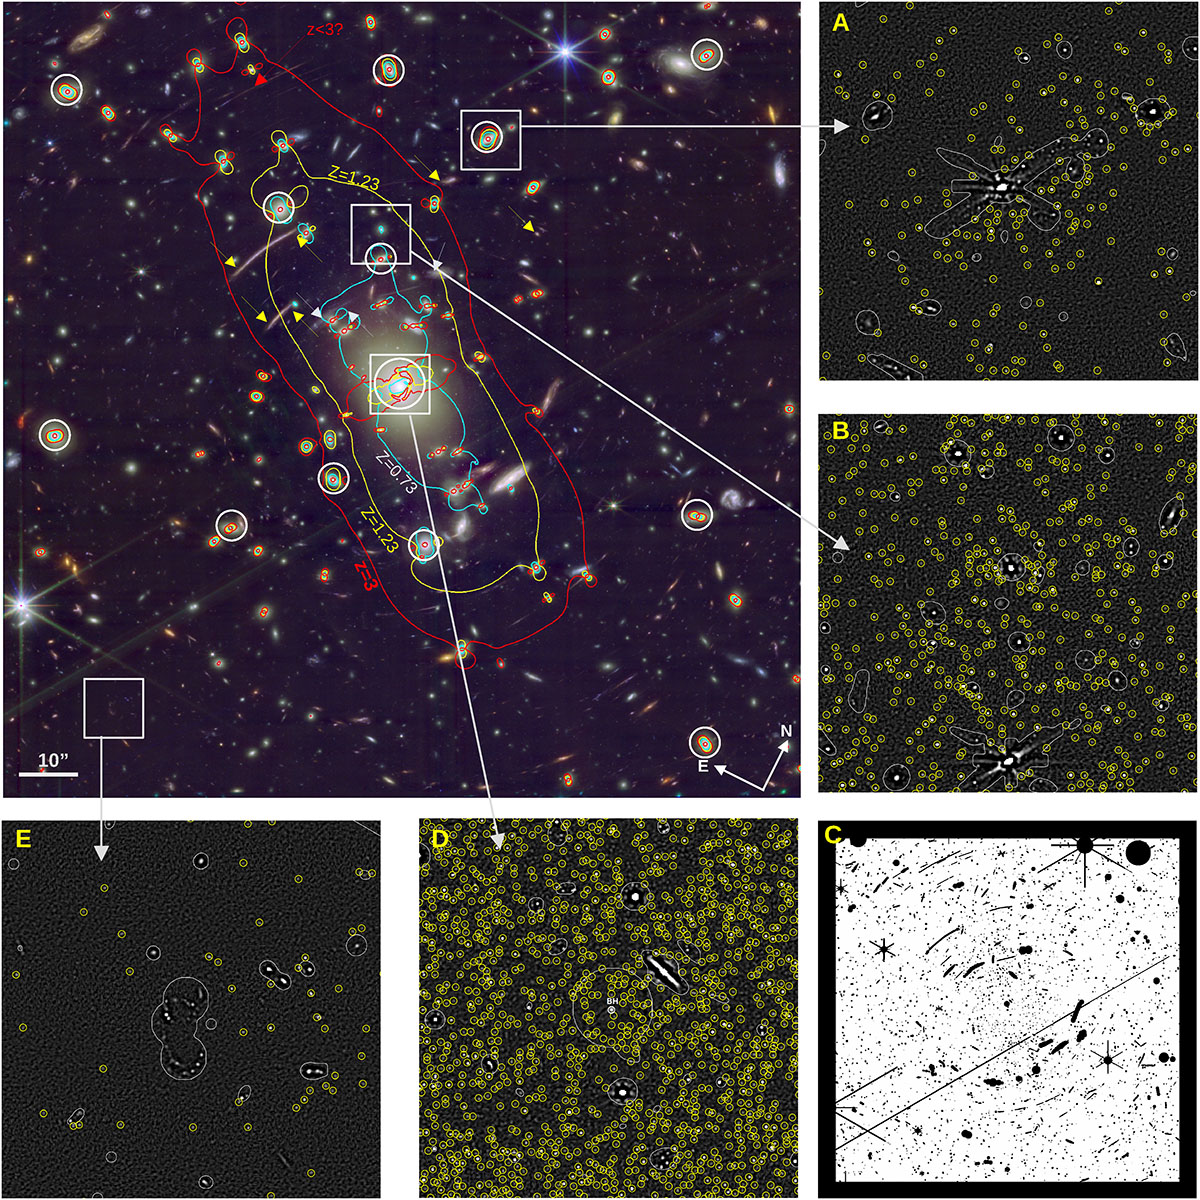
Color image of AS1063 combining 12 HST and JWST filters (range 0.4–5 micron). Three critical curves from our lens model are shown at z = 0.73 (cyan), z = 1.23 (yellow), and z = 3 (red). The yellow arrows mark two families of lensed galaxies at z ≈ 1.23 intersected by the critical curve at that redshift, while the cyan arrows mark one family of lensed images from a galaxy at z = 0.73 intersected by the corresponding critical curve (in cyan). White circles mark the position of prominent elliptical galaxies. The small panels A, B, D, and E show zoomed-in regions of a filtered version of the sum of JWST’s SW filters. Yellow circles mark the position of automatically detected point sources in the filtered images. The white contours show the masked regions where no point source detection was performed, except for the very central region (panel D) where the identification of point sources was done visually inside the 1″ radius masked region. The mask of the full region containing bright and/or extended sources as well as artifacts is shown in panel C (bottom right).
Current usage metrics show cumulative count of Article Views (full-text article views including HTML views, PDF and ePub downloads, according to the available data) and Abstracts Views on Vision4Press platform.
Data correspond to usage on the plateform after 2015. The current usage metrics is available 48-96 hours after online publication and is updated daily on week days.
Initial download of the metrics may take a while.