Fig. B.1.
Download original image
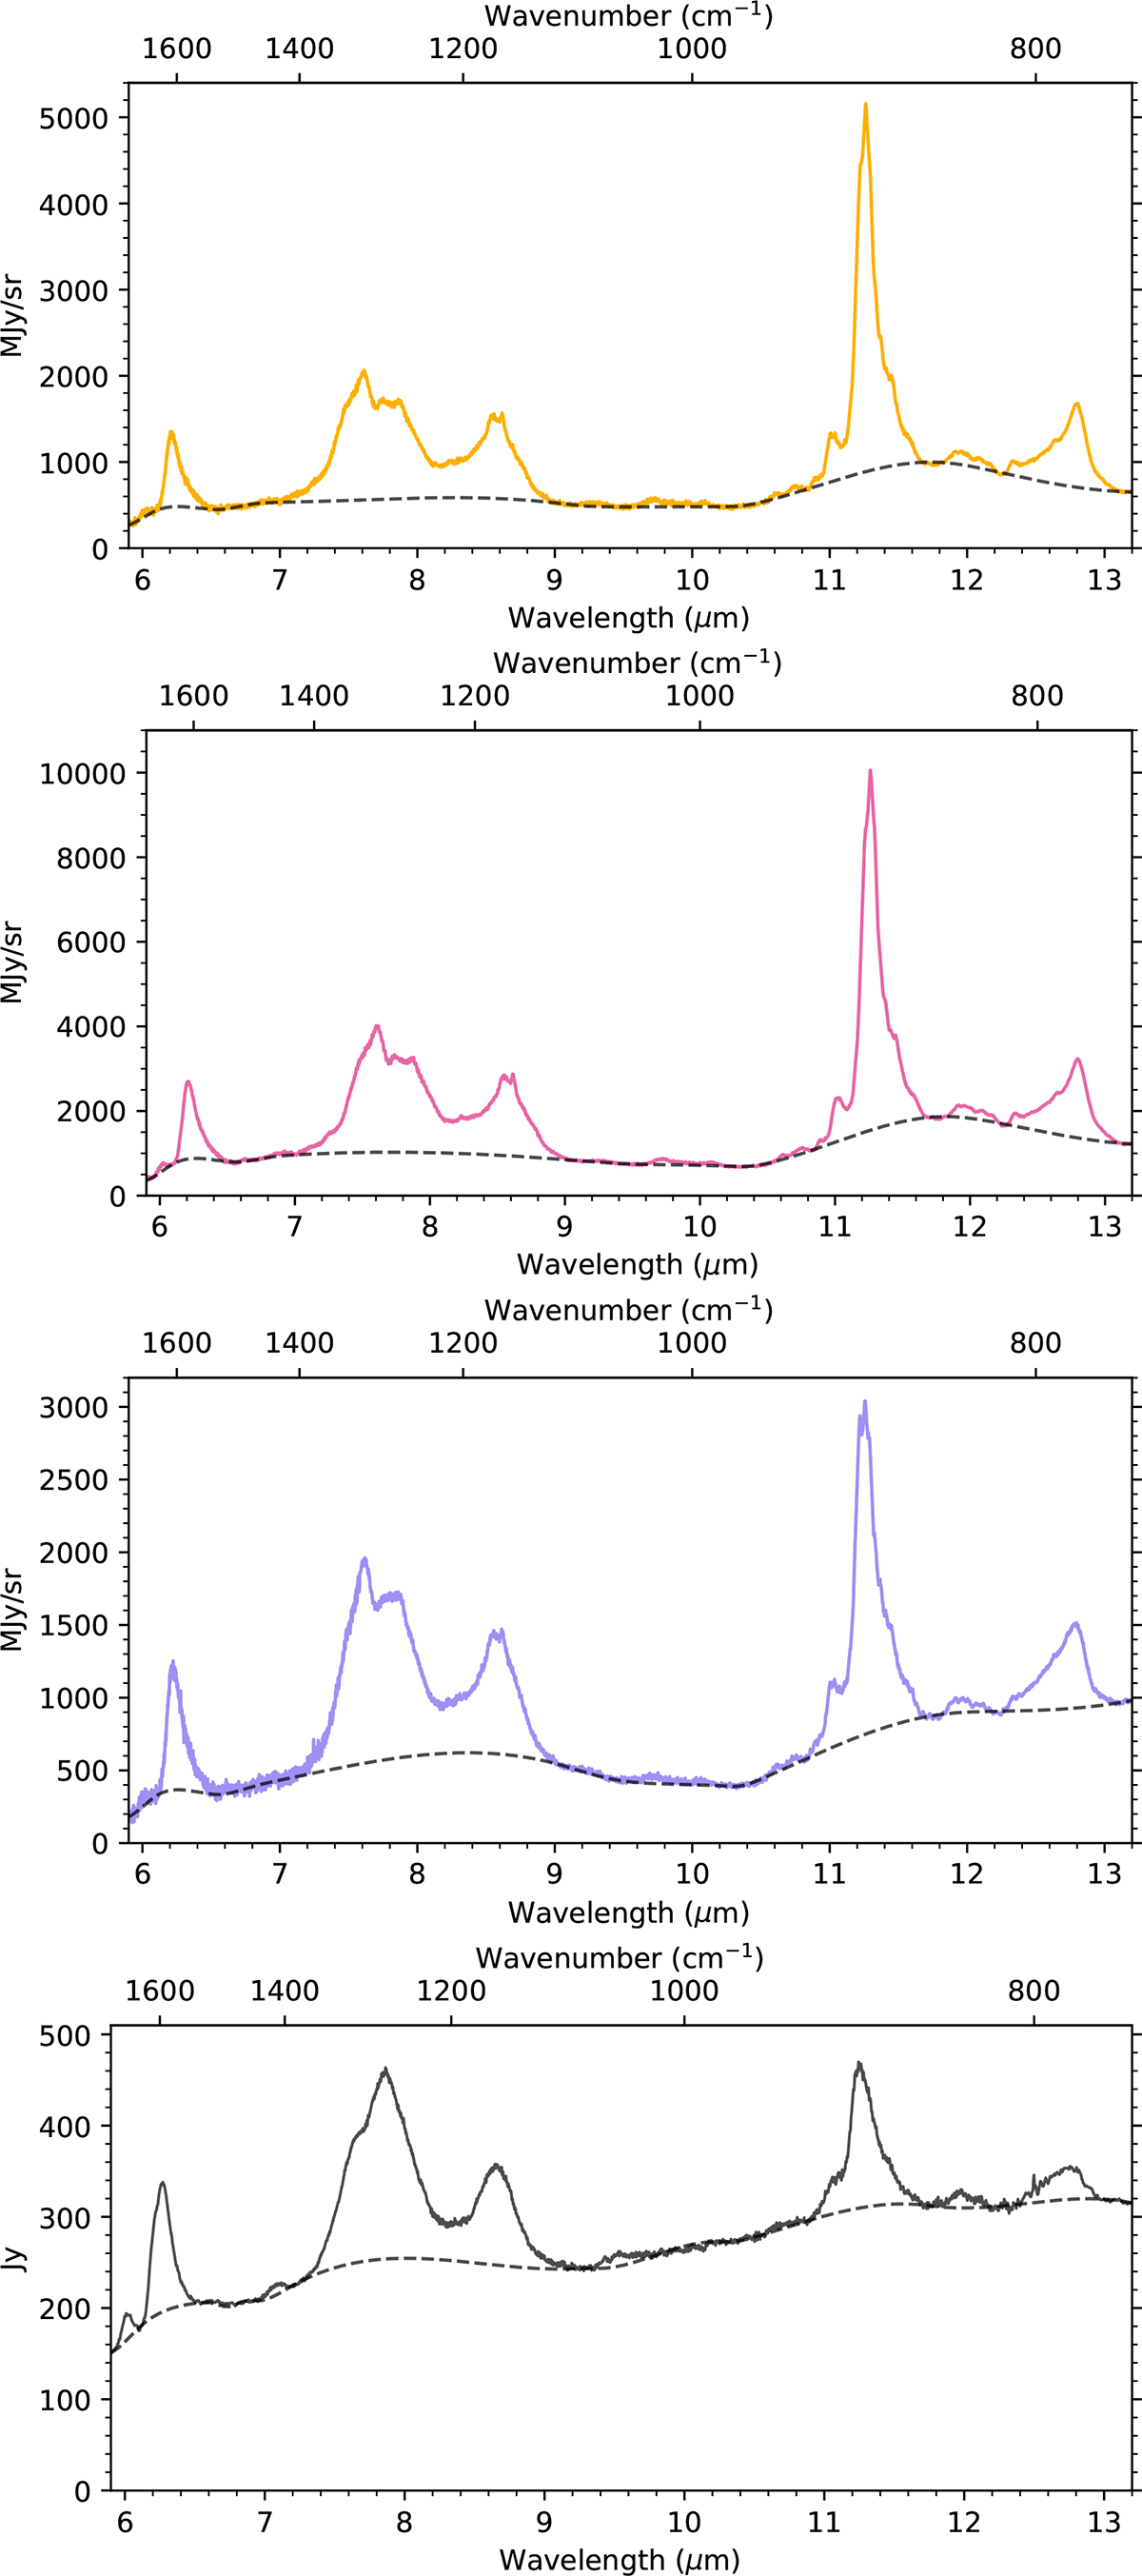
Comparison of JWST-MIRI spectra (from top: Region 1, 2, and 3) with the ISO-SWS spectrum (bottom). The MIRI apertures are defined in Fig. 1. The black dashed line indicates the continuum which was subtracted in Figs. 2 and 3. We note that the JWST spectra are in surface brightness units (MJy/sr), while the ISO-SWS spectrum is in flux density (Jy).
Current usage metrics show cumulative count of Article Views (full-text article views including HTML views, PDF and ePub downloads, according to the available data) and Abstracts Views on Vision4Press platform.
Data correspond to usage on the plateform after 2015. The current usage metrics is available 48-96 hours after online publication and is updated daily on week days.
Initial download of the metrics may take a while.