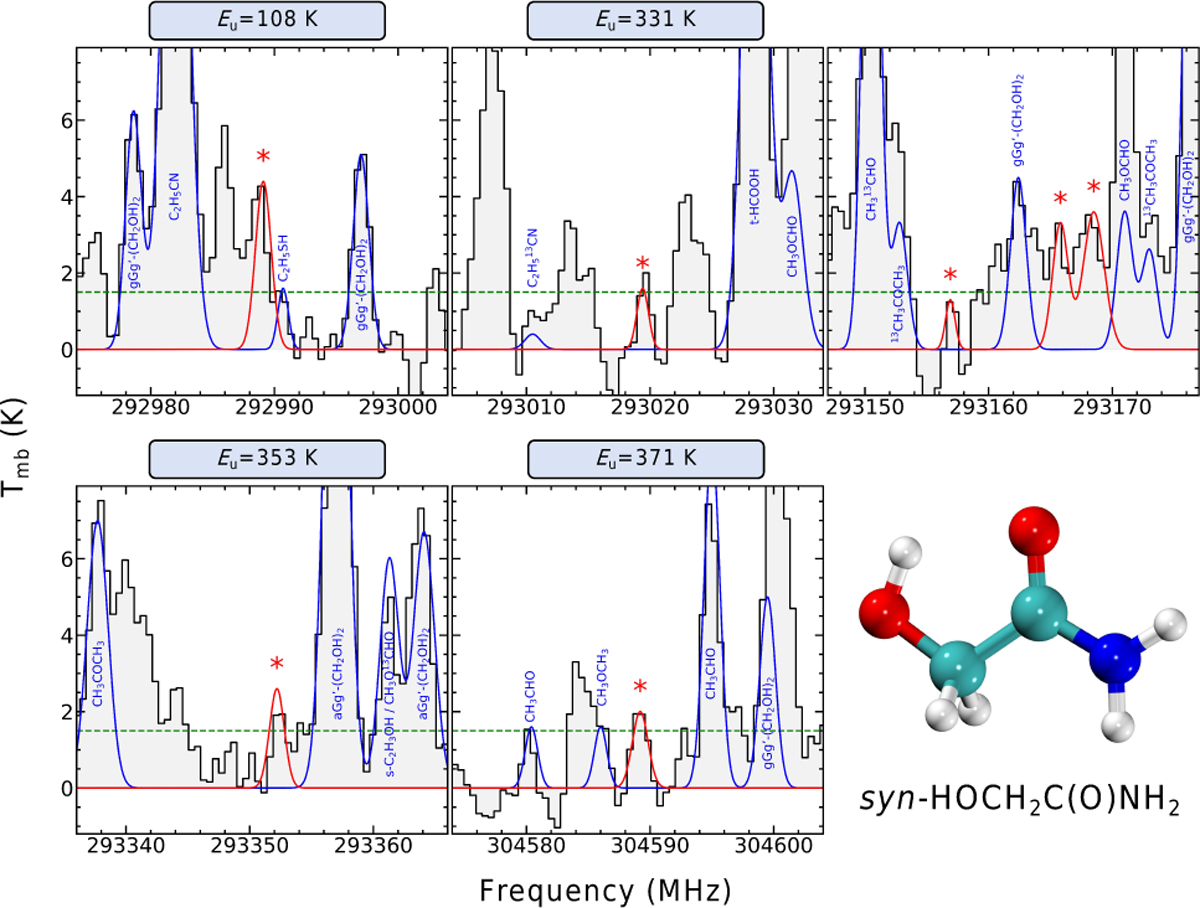
Fig. 2
Download original image
Unblended or only slightly blended emission lines (red asterisks) of syn-HOCH2C(O)NH2 toward G358.93 MM1. Black lines show the observed spectra, while red lines represent the LTE model of syn-HOCH2C(O)NH2. Blue lines correspond to a composite model that includes contributions from all other identified molecular species. Dashed green lines mark the 3σ noise level. The upper-level energies (Eu) of the transitions are given above each panel.
Current usage metrics show cumulative count of Article Views (full-text article views including HTML views, PDF and ePub downloads, according to the available data) and Abstracts Views on Vision4Press platform.
Data correspond to usage on the plateform after 2015. The current usage metrics is available 48-96 hours after online publication and is updated daily on week days.
Initial download of the metrics may take a while.